Dr Sohail Bhatti’s presentation on Health Inequality in Huddersfield to the Socialist Health Association Conference on the Black Report
9th September, 2005
Dr Sohail S Bhatti, Director of Public Health, Huddersfield Central PCT & South Huddersfield PCT
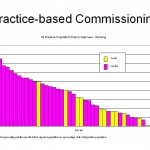
The Problem (The LOCK)
- No agreed description of deprivation at a level below ward (14,000 residents) in 2002
- SOA deprivation covers 5,000 residents
- Census 2001 data at OA level (600 residents)
- Real needs & real inequalities
- Lots of routine activity data
- Services delivered to individuals & households
Kirklees Council keen to tackle them
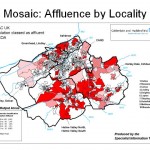
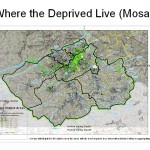
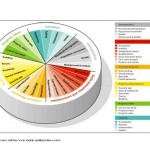
Mosaic (KEY)
- Prof Richard Webber (ACORN) developed it
- 61 Types – derived from 400 data items
- Mapped to IMD 2004
- Postcode level data
- Commercially used & valued
Examples of Use:
- In Epidemiology
- In Service Planning & Monitoring
- In Political Action
Population of Huddersfield:
| FHS Registered Population | FHS Ward Resident Population | |||
| March-05 | Jan-03 | March-05 | Difference | |
| Huddersfield Central PCT | 136696 | 145255 | 146770 | +1515 |
| South Huddersfield PCT | 91796 | 84142 | 86286 | +2144 |
| Huddersfield Total March 2005 *Includes 151 temporary patients | 228492 | 229397 | *233056 | +3659 |
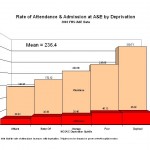
PCT Deprivation
UK-based Postcode Quintiles (Quintiles are large enough to compute robust statistics eg SMR, Life Expectancy)
| Affluent | Better Off | Average | Poor | Deprived | Unknown | |
| Huddersfield Central | 20,015 | 18,376 | 28,186 | 23,702 | 54,767 | 963 |
| South Huddersfield | 28,263 | 19,684 | 16,753 | 14,299 | 5,128 | 1,234 |
| TOTAL | 48,278 | 38,060 | 44,939 | 38,001 | 59,895 | 2197 |
Total 2003 FHS population = 231,370
Of the 20% residents in UK with the lowest economic profile, we have 59,895 Source: Experian (MOSAIC)
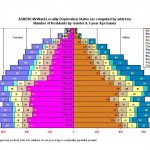
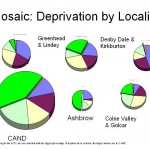
Locality Mosaic percentage deprivation score 2005
| Affluent | Better Off | Average | Poor | Deprived | Unknown | |
| Ashbrow | 22.81 | 4.10 | 11.56 | 12.62 | 48.38 | 0.52 |
| Colcar and Colne Valley | 8.52 | 17.65 | 28.25 | 23.66 | 20.78 | 1.14 |
| CAND | 10.41 | 13.25 | 13.77 | 19.99 | 41.65 | 0.93 |
| Kirkburton & Denby Dale | 44.94 | 25.52 | 11.61 | 13.69 | 1.27 | 2.97 |
| Greenhead & Lindley | 18.09 | 16.48 | 26.67 | 10.25 | 27.26 | 1.25 |
| Total | 34.02 | 20.44 | 25.72 | 11.65 | 6.48 | 1.69 |
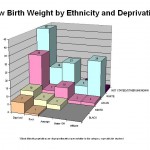
Live Births 1994-2003 by Mosaic Average Annual Numbers
| Resident PCT | Affluent | Better Off | Average | Poor | Deprived | Unknown |
| Central | 197 | 150 | 323 | 247 | 856 | 10 |
| South | 280 | 179 | 173 | 126 | 68 | 9 |