Choice, Markets, Competition in the NHS – What does this mean for health inequality?
Talk by Dr Tony Jewell on behalf of Association of Directors of Public Health Ipswich 25/1/06 at our seminar
Three key issues
- Inequalities and disadvantage – what are the determinants and how can they be modified?
- Choice, markets and competition – what is the international and national experience of impact on inequalities?
- A better deal for the disadvantaged by redistribution of wealth nationally and partnership with local government, and using local area agreements.
Inequalities
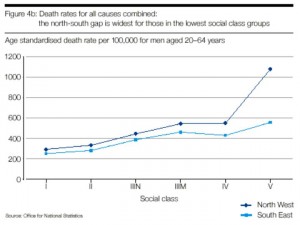
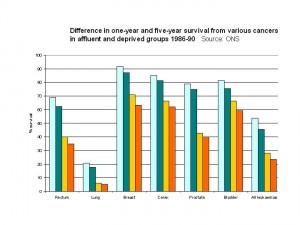
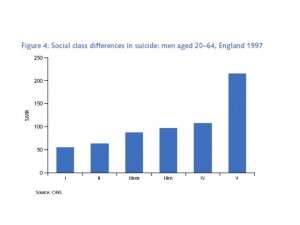
PPT slides extracted from Prof Selena Gray presentation setting out how inequalities can be measured by social class, socio-economic groups, geographical areas, sex and age, ethnicity and by vulnerable groups.
Material Inequalities:
- 17% population cannot afford adequate housing ie heated, damp free and decorated
- 13% cannot afford two or more “essentials” such as fridge, telephone, carpets
- 33% of British children go without at least one of perceived “necessities” such as 3 meals a day, toys or adequate clothing.
Source: Joseph Rowntree Foundation 2000
Healthy life expectancy- top five
- East Surrey 72.7 years
- Suffolk 72.6 years
- Oxfordshire 72.3 years
- North and East Devon 72.3 years
- Wiltshire 72.2 years
Healthy life expectancy: Bottom Five
- Manchester 61.0 years
- Barnsley 62.1 years
- Liverpool 62.4 years
- Wigan and Bolton 62.6 years
- Sunderland 63.2 years
Ethnicity
|
Group
|
Rate of Tuberculosis per 100,000
|
|
White
|
4
|
|
Indian Subcontinent
|
127
|
|
Black African
|
192
|
Vulnerable Groups
Mortality in young offenders compared to the rest of the population in Australia
8.5/1000 deaths per year compared to 1.1/1000 reference population
Males x9 and females x40 more likely to die than reference population
Source: Coffey et al, BMJ 2003
Health of the homeless
- Homeless young men aged 16 to 29 had a death risk 40 times the national average
- For men aged 16 to 64 years, the risk was estimated to be 25 times greater.
- More at risk from accidents, suicide, alcohol and drug related illness, liver disease and respiratory infections such as tuberculosis, pneumonia and bronchitis Shaw et al
Homeless persons
- Only 40% have any qualifications
- 30-50% more likely to have mental health problems
- 50% serious alcohol problems
- 80% drug problems
Inequalities in Europe
Gap between the highest and lowest life expectancy is:
2 years in Sweden
15 in the Russian Federation.
Global Inequalities
Infant mortality rate is a good global measure of overall health
- Sierra Leone 316/1000 births
- India 54 per 1000 births
- England 5 per 1000
Rates reflected in life expectancy eg approx 40 years in sub-saharan africa
Significant health inequalities within developing and developed countries. Indigenous people often have very poor health
- Aboriginal population LE 20 years less than rest of Australia;
- Maori population 8 years less that rest of NZ
BMJ 2003
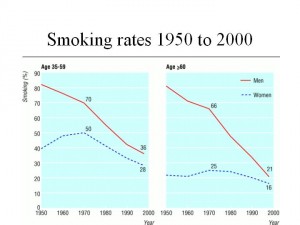
Attributable deaths from tobacco
- 85% of all lung cancer
- 85% of chronic obstructive airways disease
- 17% of all ischaemic heart disease
- Some estimates attribute half of all inequalites in health are due to tobacco
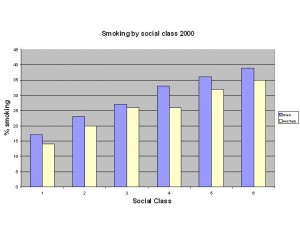
The data shows how big the inequalities are, how in some cases they are widening.
Slides from Michael Marmot presentation to EU Summit shows how while improvements in say life expectancy have occured yet the inequalities are increasing (relative inequality increased 2% for men and 5% for women) He makes the point that the solid determinants of health are very broad and need to be modified to deliver the targets. Such wide inequalities are not inevitable eg Sweden
“Fairer societies are healthier societies” Wilkinson
More democratic and freer societies also improve health.
Choice
Is health a commodity?
What is our experience of the markets we know eg property, cars, money market? Good for the disadvantaged?
Map showing North/South divide in UK – is the market not free across the country? Is this a product of the market (health services make relatively small impact on health inequalities)?
Health services – USA most market oriented – high cost/poor health with 46m uninsured. Those who advocate the market should point us to where it is a success and how it delivers equity.
NHS and DsPH
There is another way of approaching this. There are some current policy initiatives which support Joint needs assessments for local populations – community profiles/health atlases. The local area agreements between LA/NHS are new ways of mediating the duty of partnership between these two statutory sectors with public health accountabilities. There are PSA targets which need to be actively performance managed
There are opportunities for appointing joint Directors of Public Health between LA/NHS to provide the leadership for this direction of travel. This is the way ahead for strategically modifying the structural determinants at national and local levels.
