The next stage of the enquiry was to compare the average consumption of each food as shown in the budgets, weighted by the proportions of the population in each group, with the national consumption per head given in Table 1. Owing to the relatively small number of budgets available no exact correspondence could be expected, but for most foods a fair measure of agreement was obtained. Certain discrepancies were to be expected. For example, the national averages are based upon food supplies at the point of origin, whereas the budget data give weights of food as purchased from the shops. Some allowance has therefore to be made for wastage in distribution. Secondly, for some foods the budget data, having been collected over short periods of a week or month, were affected by seasonal factors. This was particularly noticeable in the case of eggs. Thirdly, the national averages do not show separate quantities and values for complex foodstuffs, such as cakes, jams and confectionery, as the family budgets do. These, and other sources of discrepancy are discussed in Appendix VI, where three tables are included, the first giving quantities of food consumed as shown in 1,152 family budgets, and the other two estimated consumption and expenditure in the six income groups of the entire population.
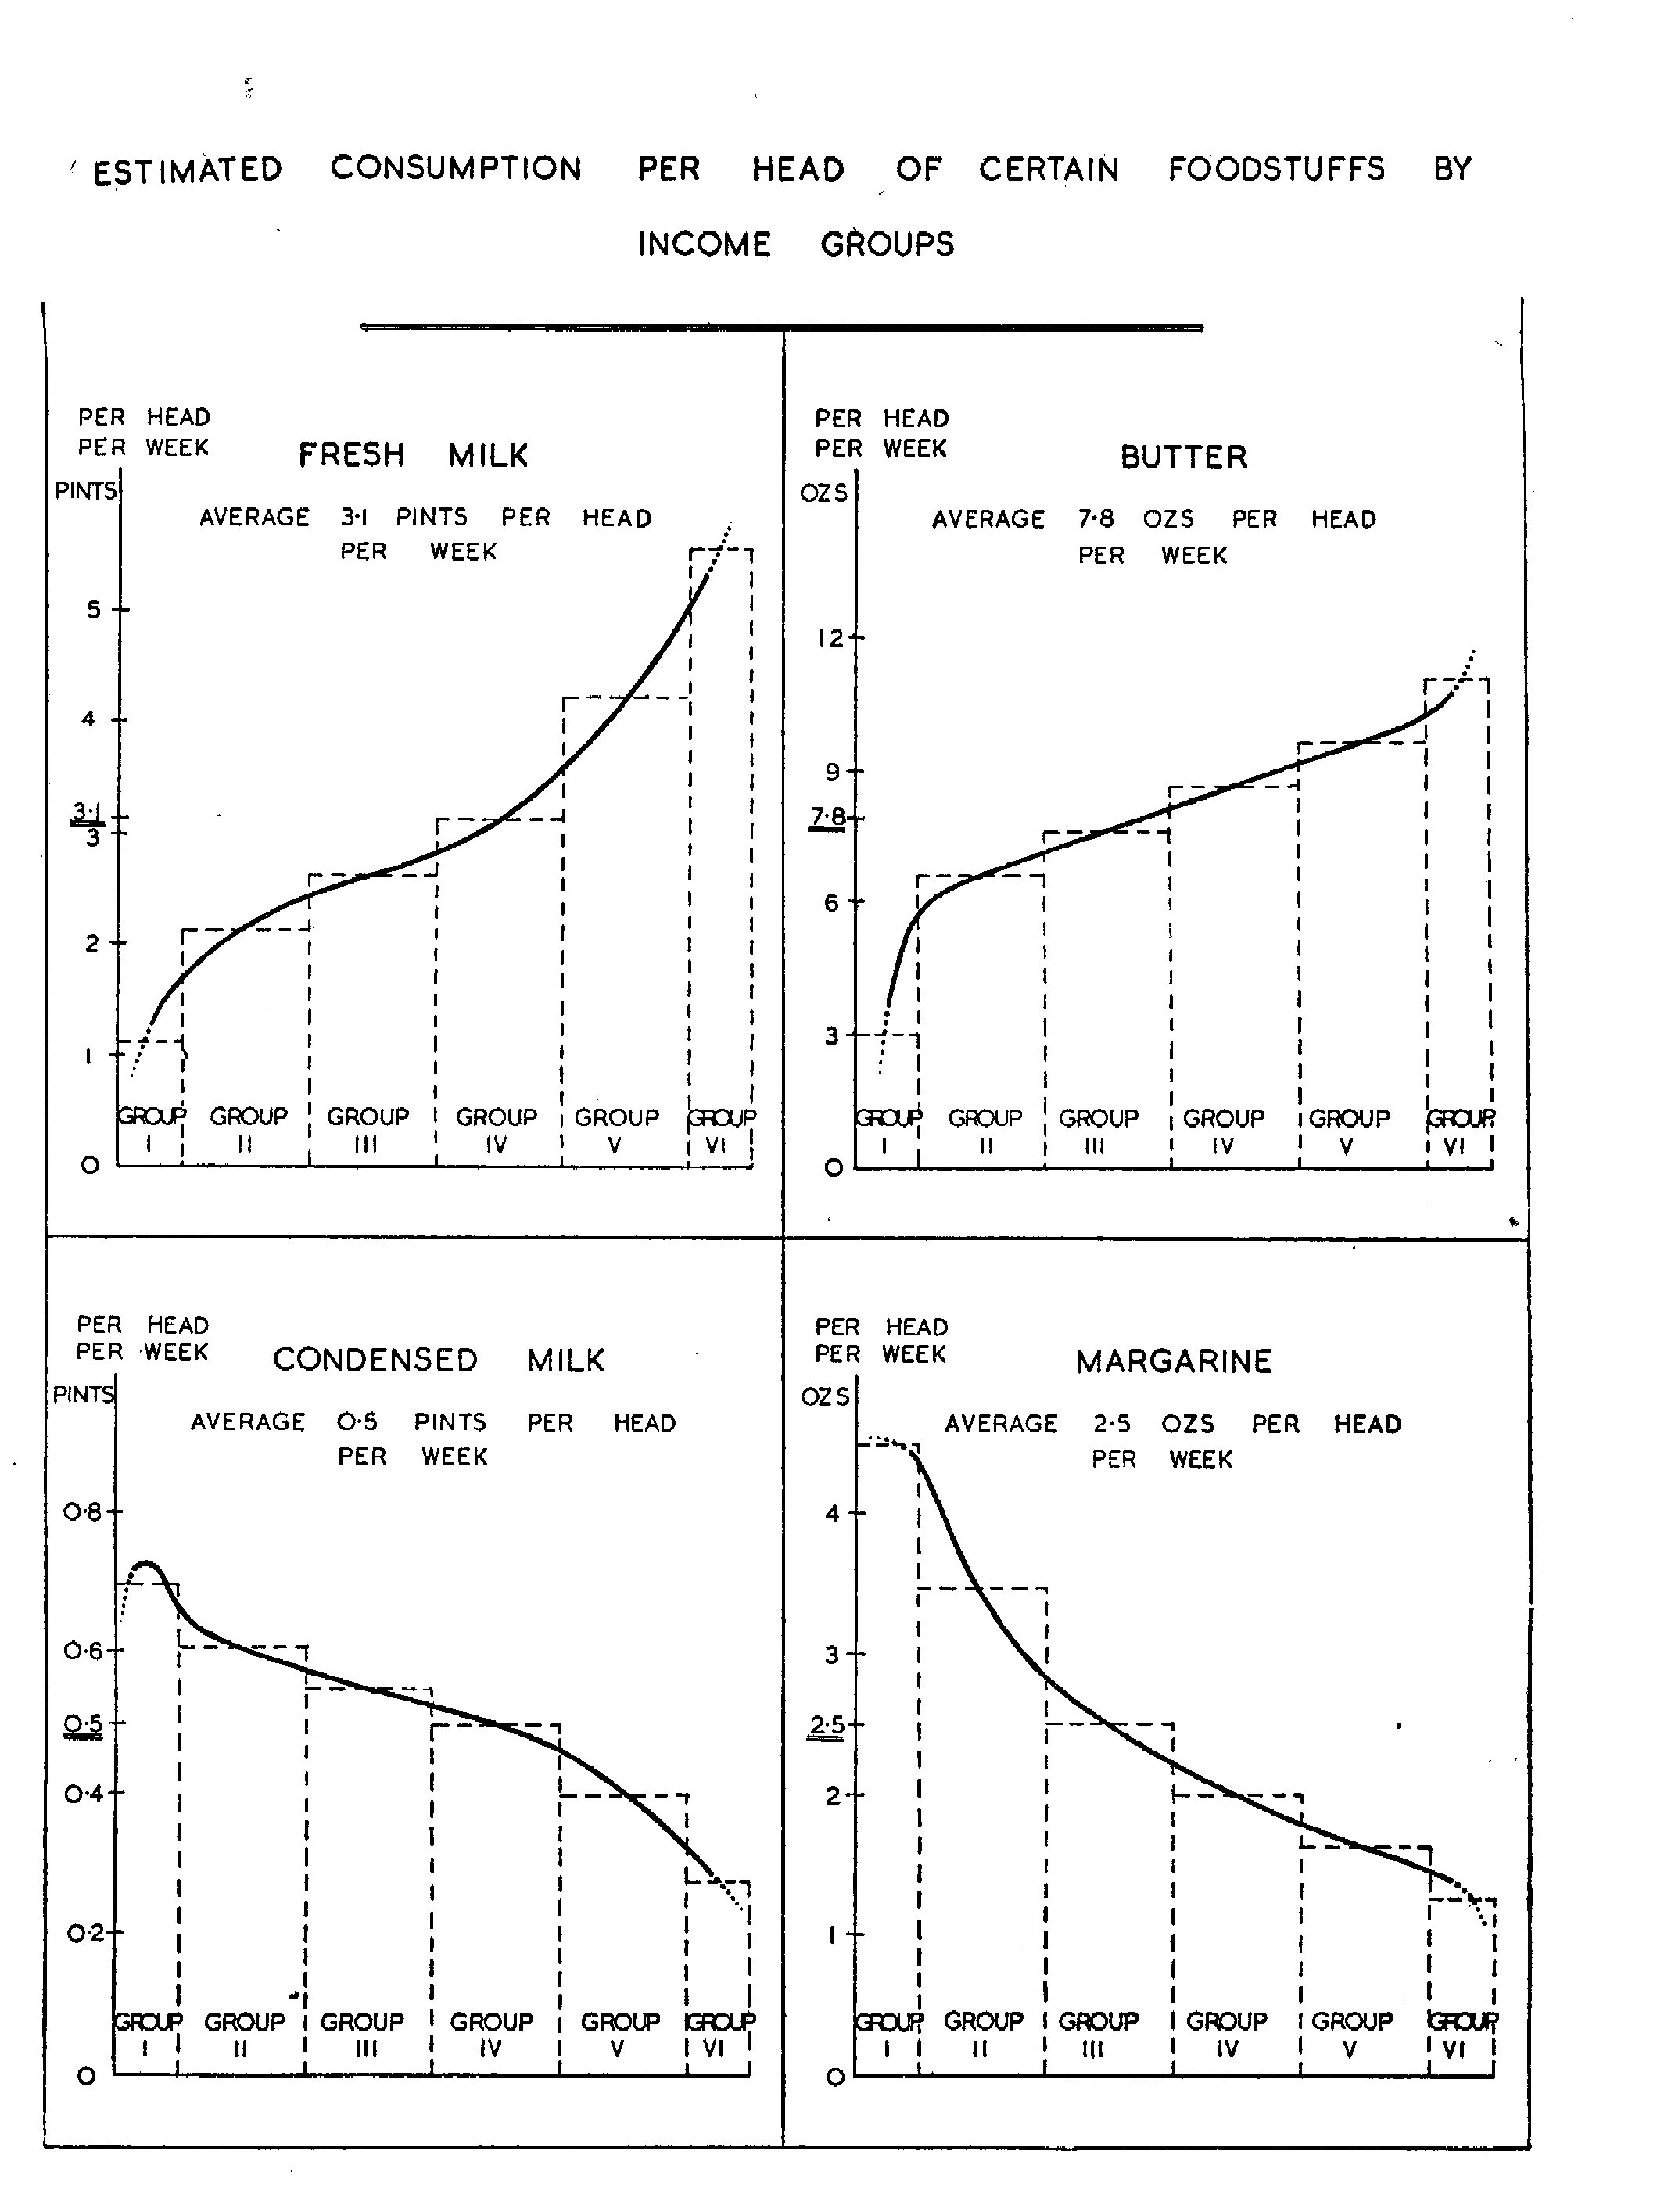
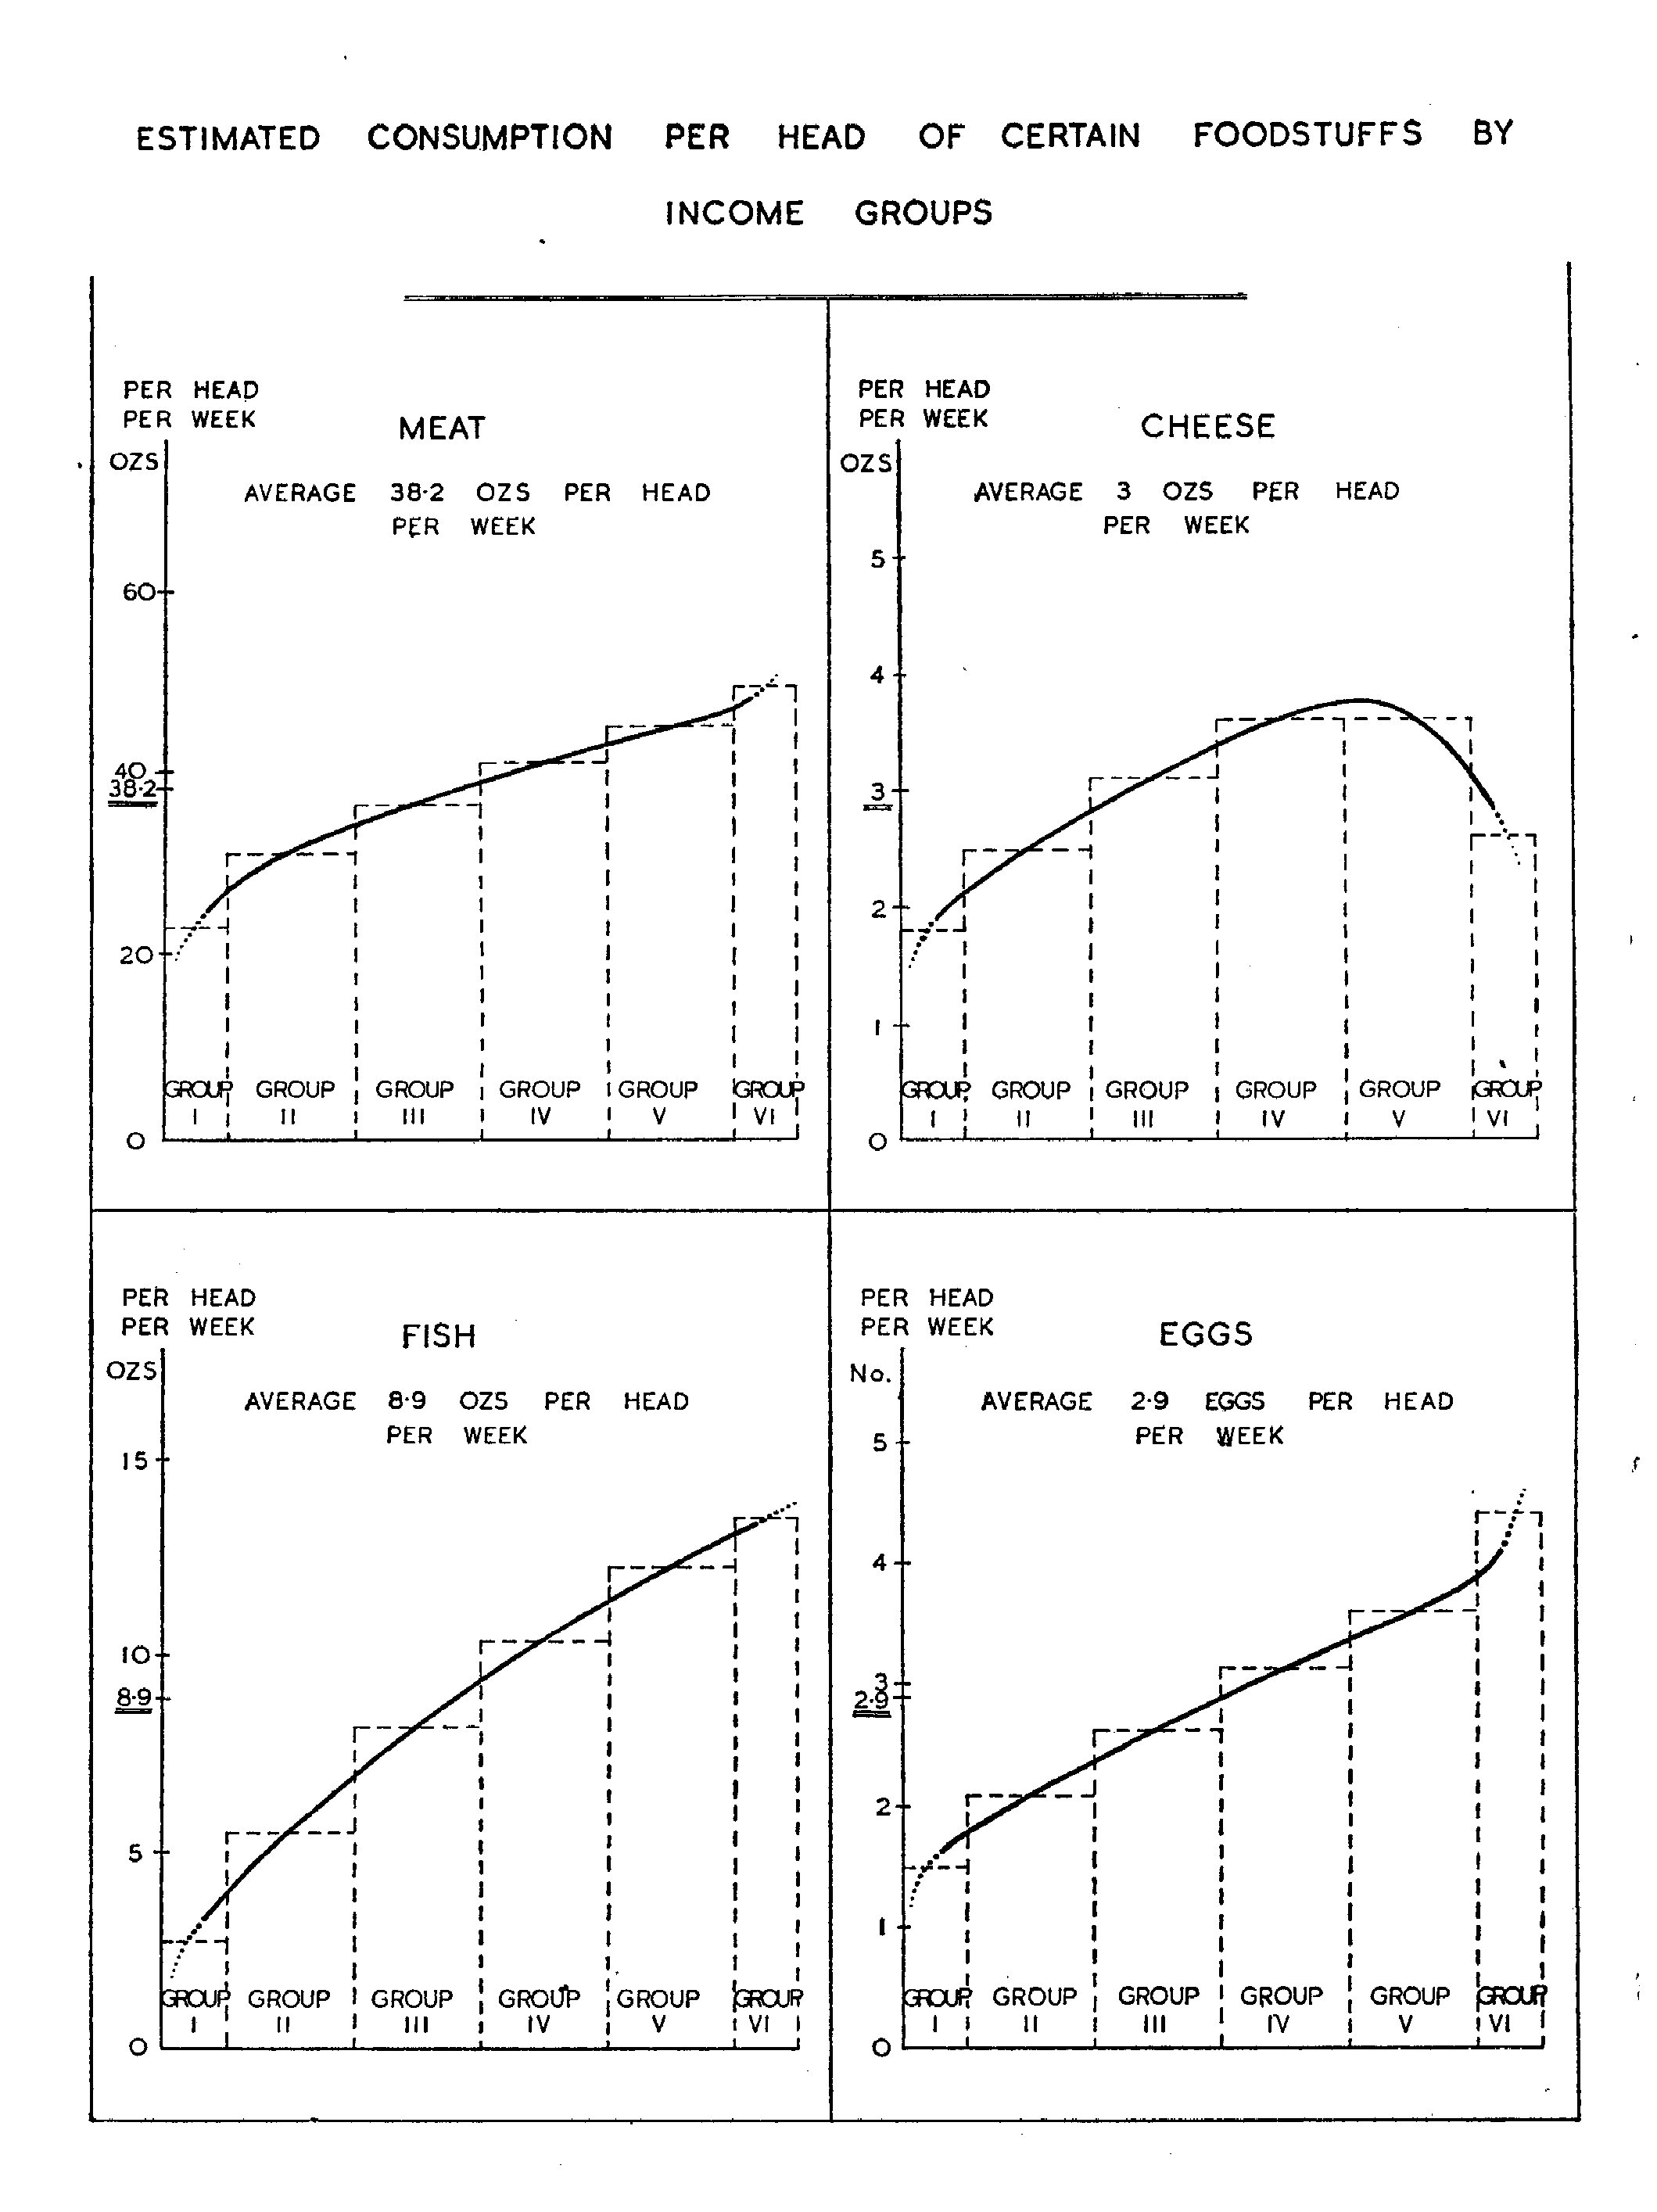
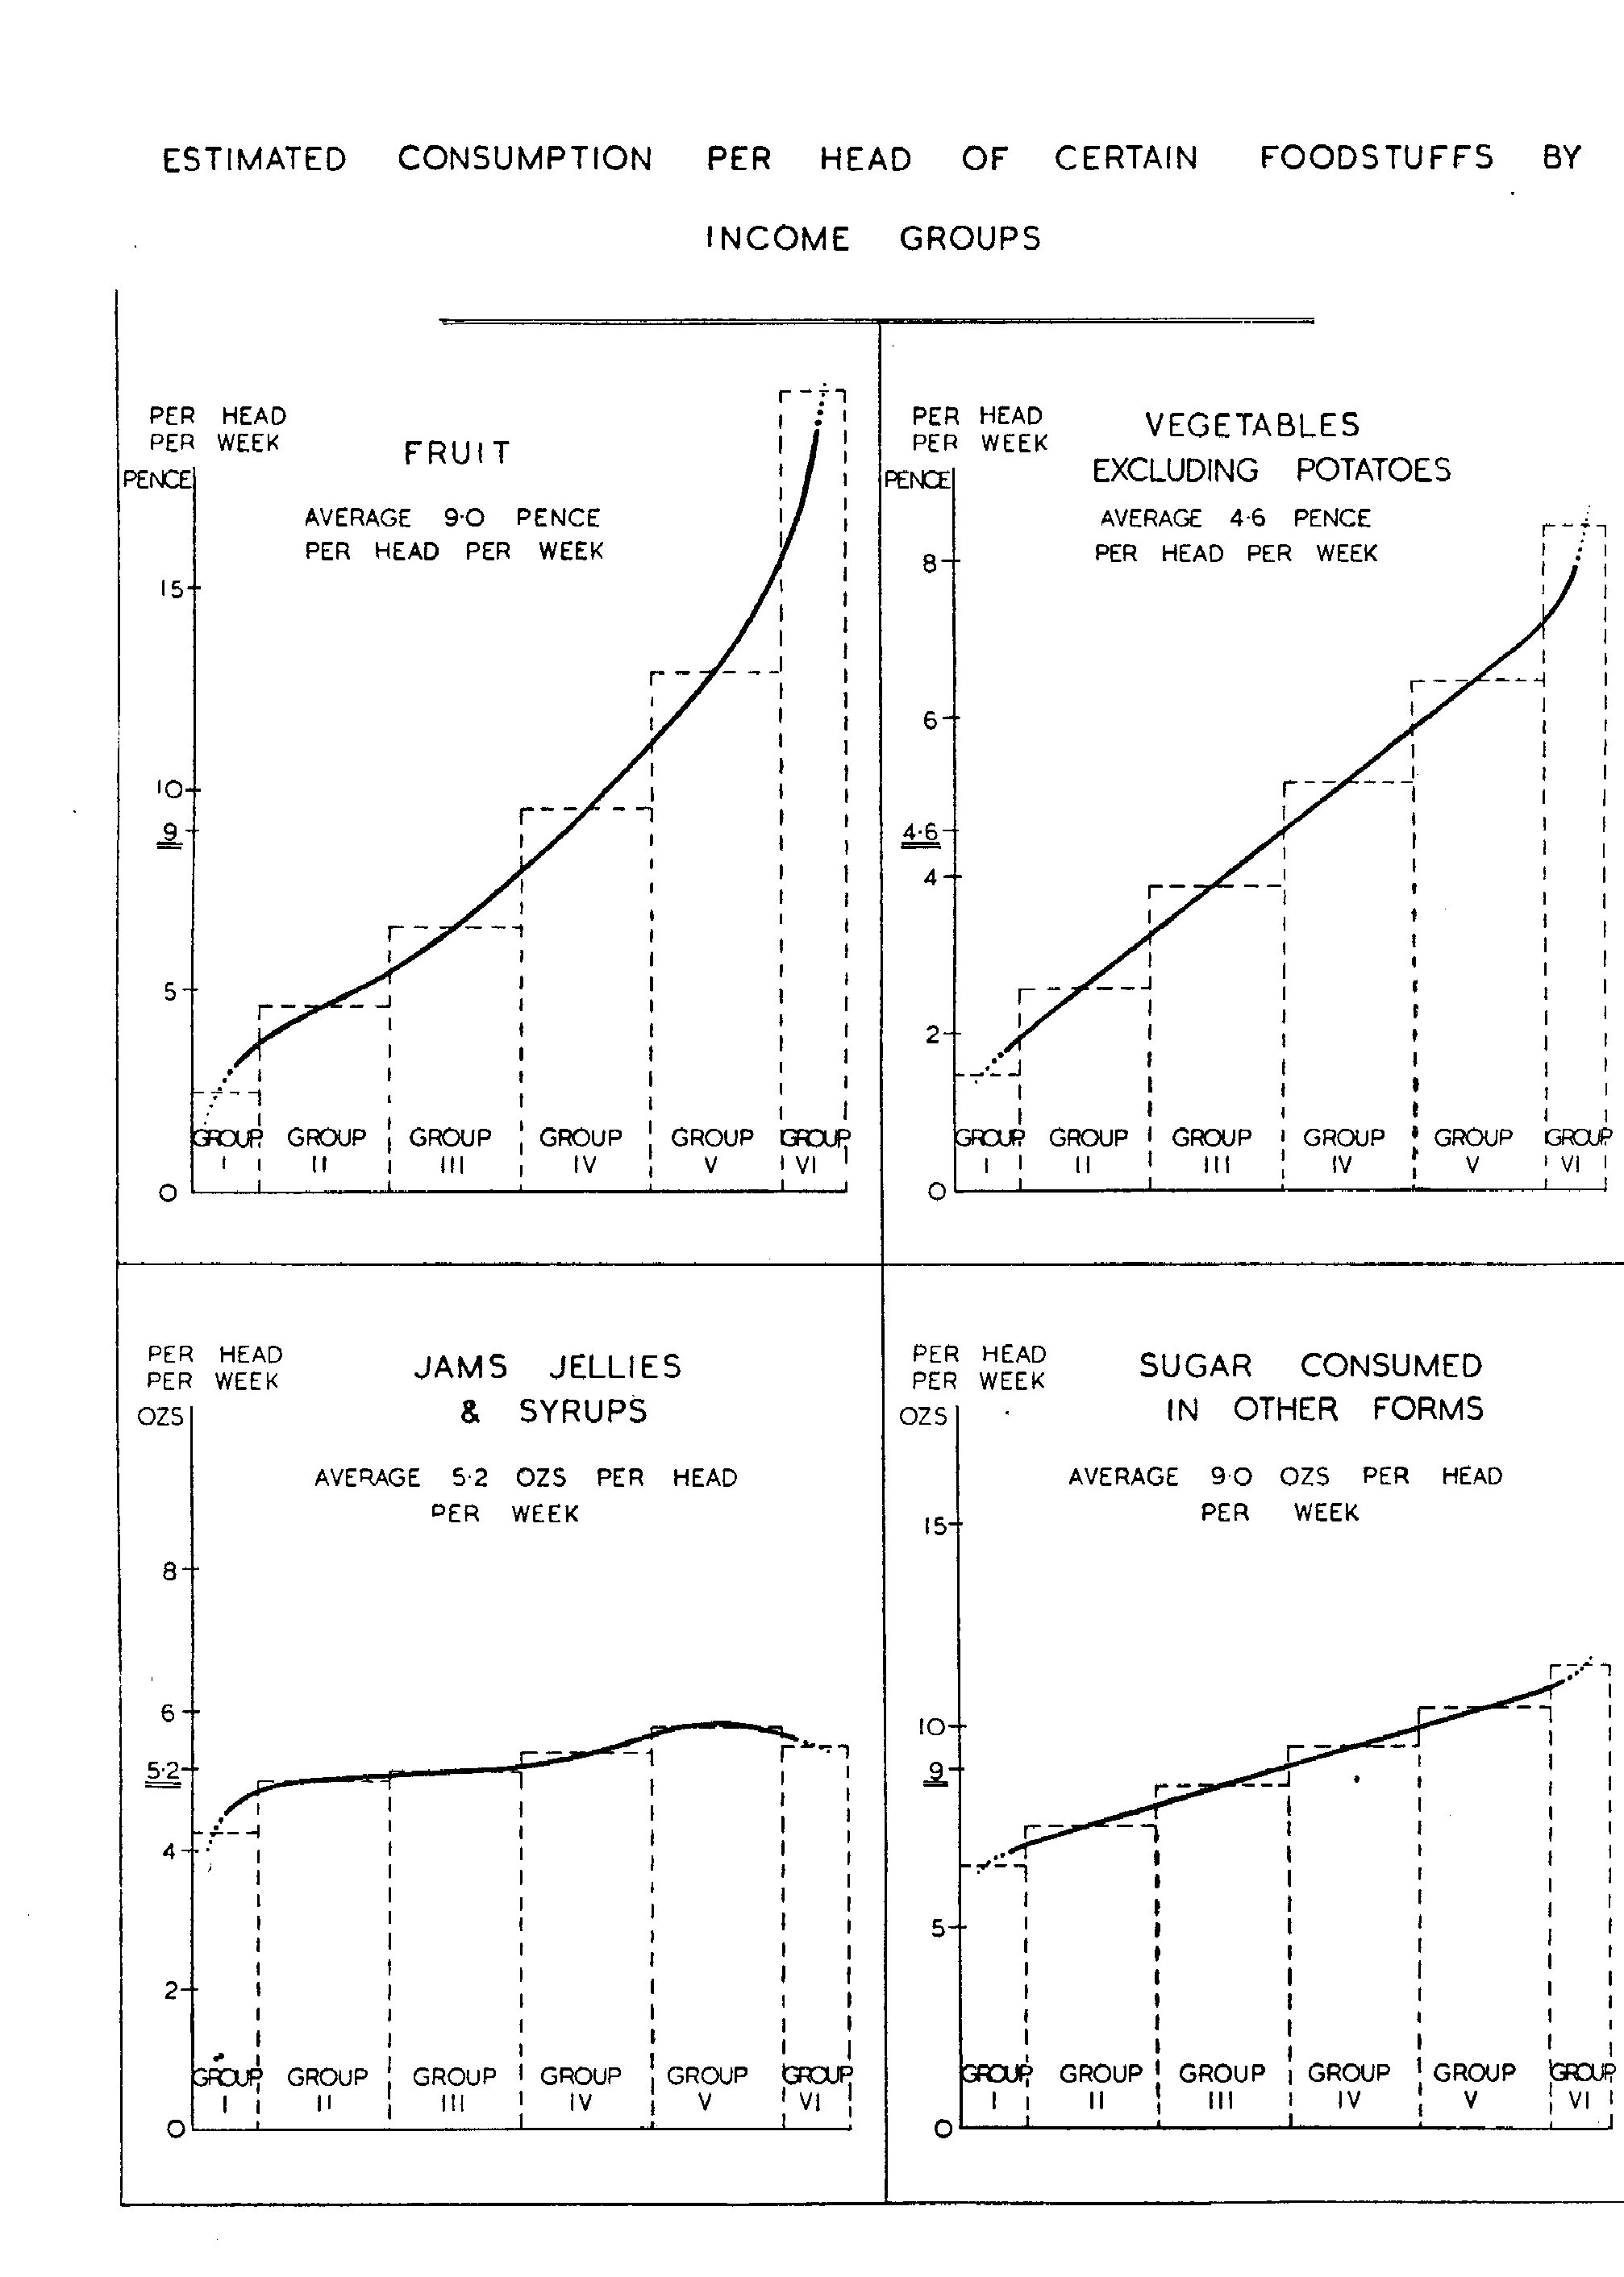
The variation in consumption of the principal foods in the different income groups is also shown in the following graphs, which bring out clearly the resemblances and differences. It should be observed that the scales adopted are designed to yield a direct comparison to the eye of the relative variation in each group from the national average consumption. Thus the average quantity of fresh milk consumed is about six times that of condensed and dried milk; and consequently the scale for the latter is about six tunes as large as that of the former. Similarly the scale for margarine is approximately three tunes that for butter. The graphs do not yield direct comparison to the eye of the absolute average quantities of each food consumed, but these are indicated in the figures given in the scales.
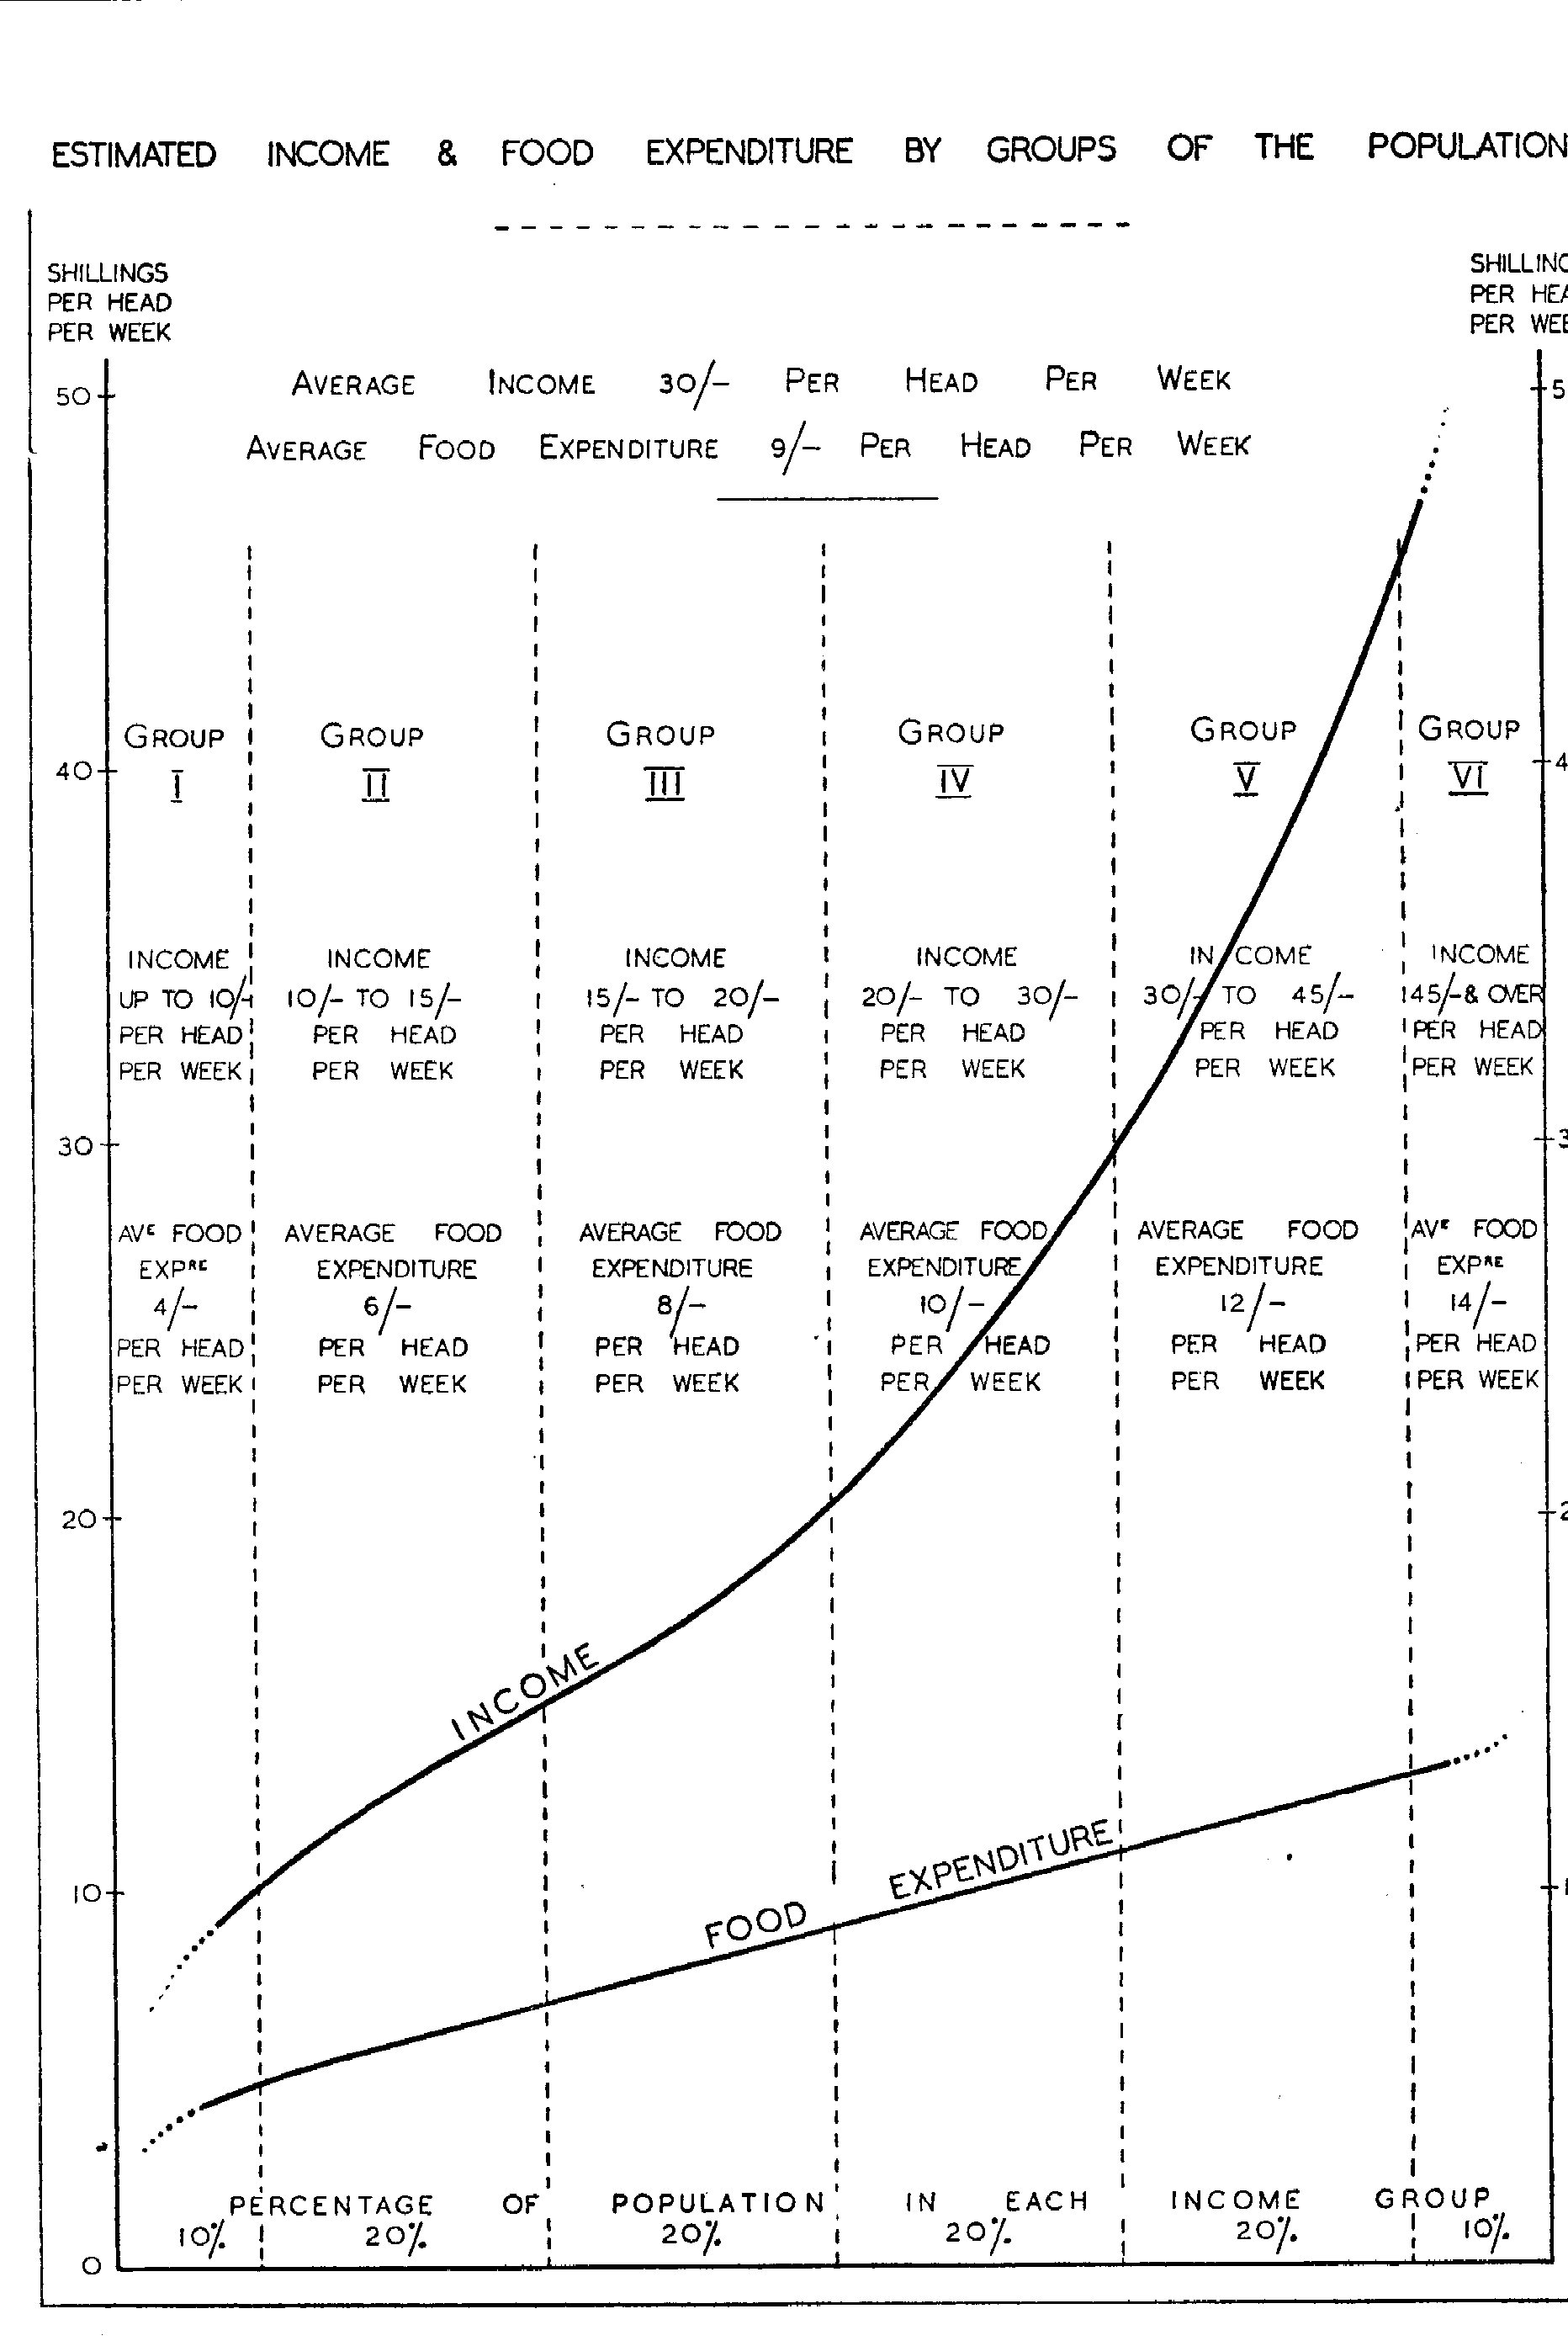
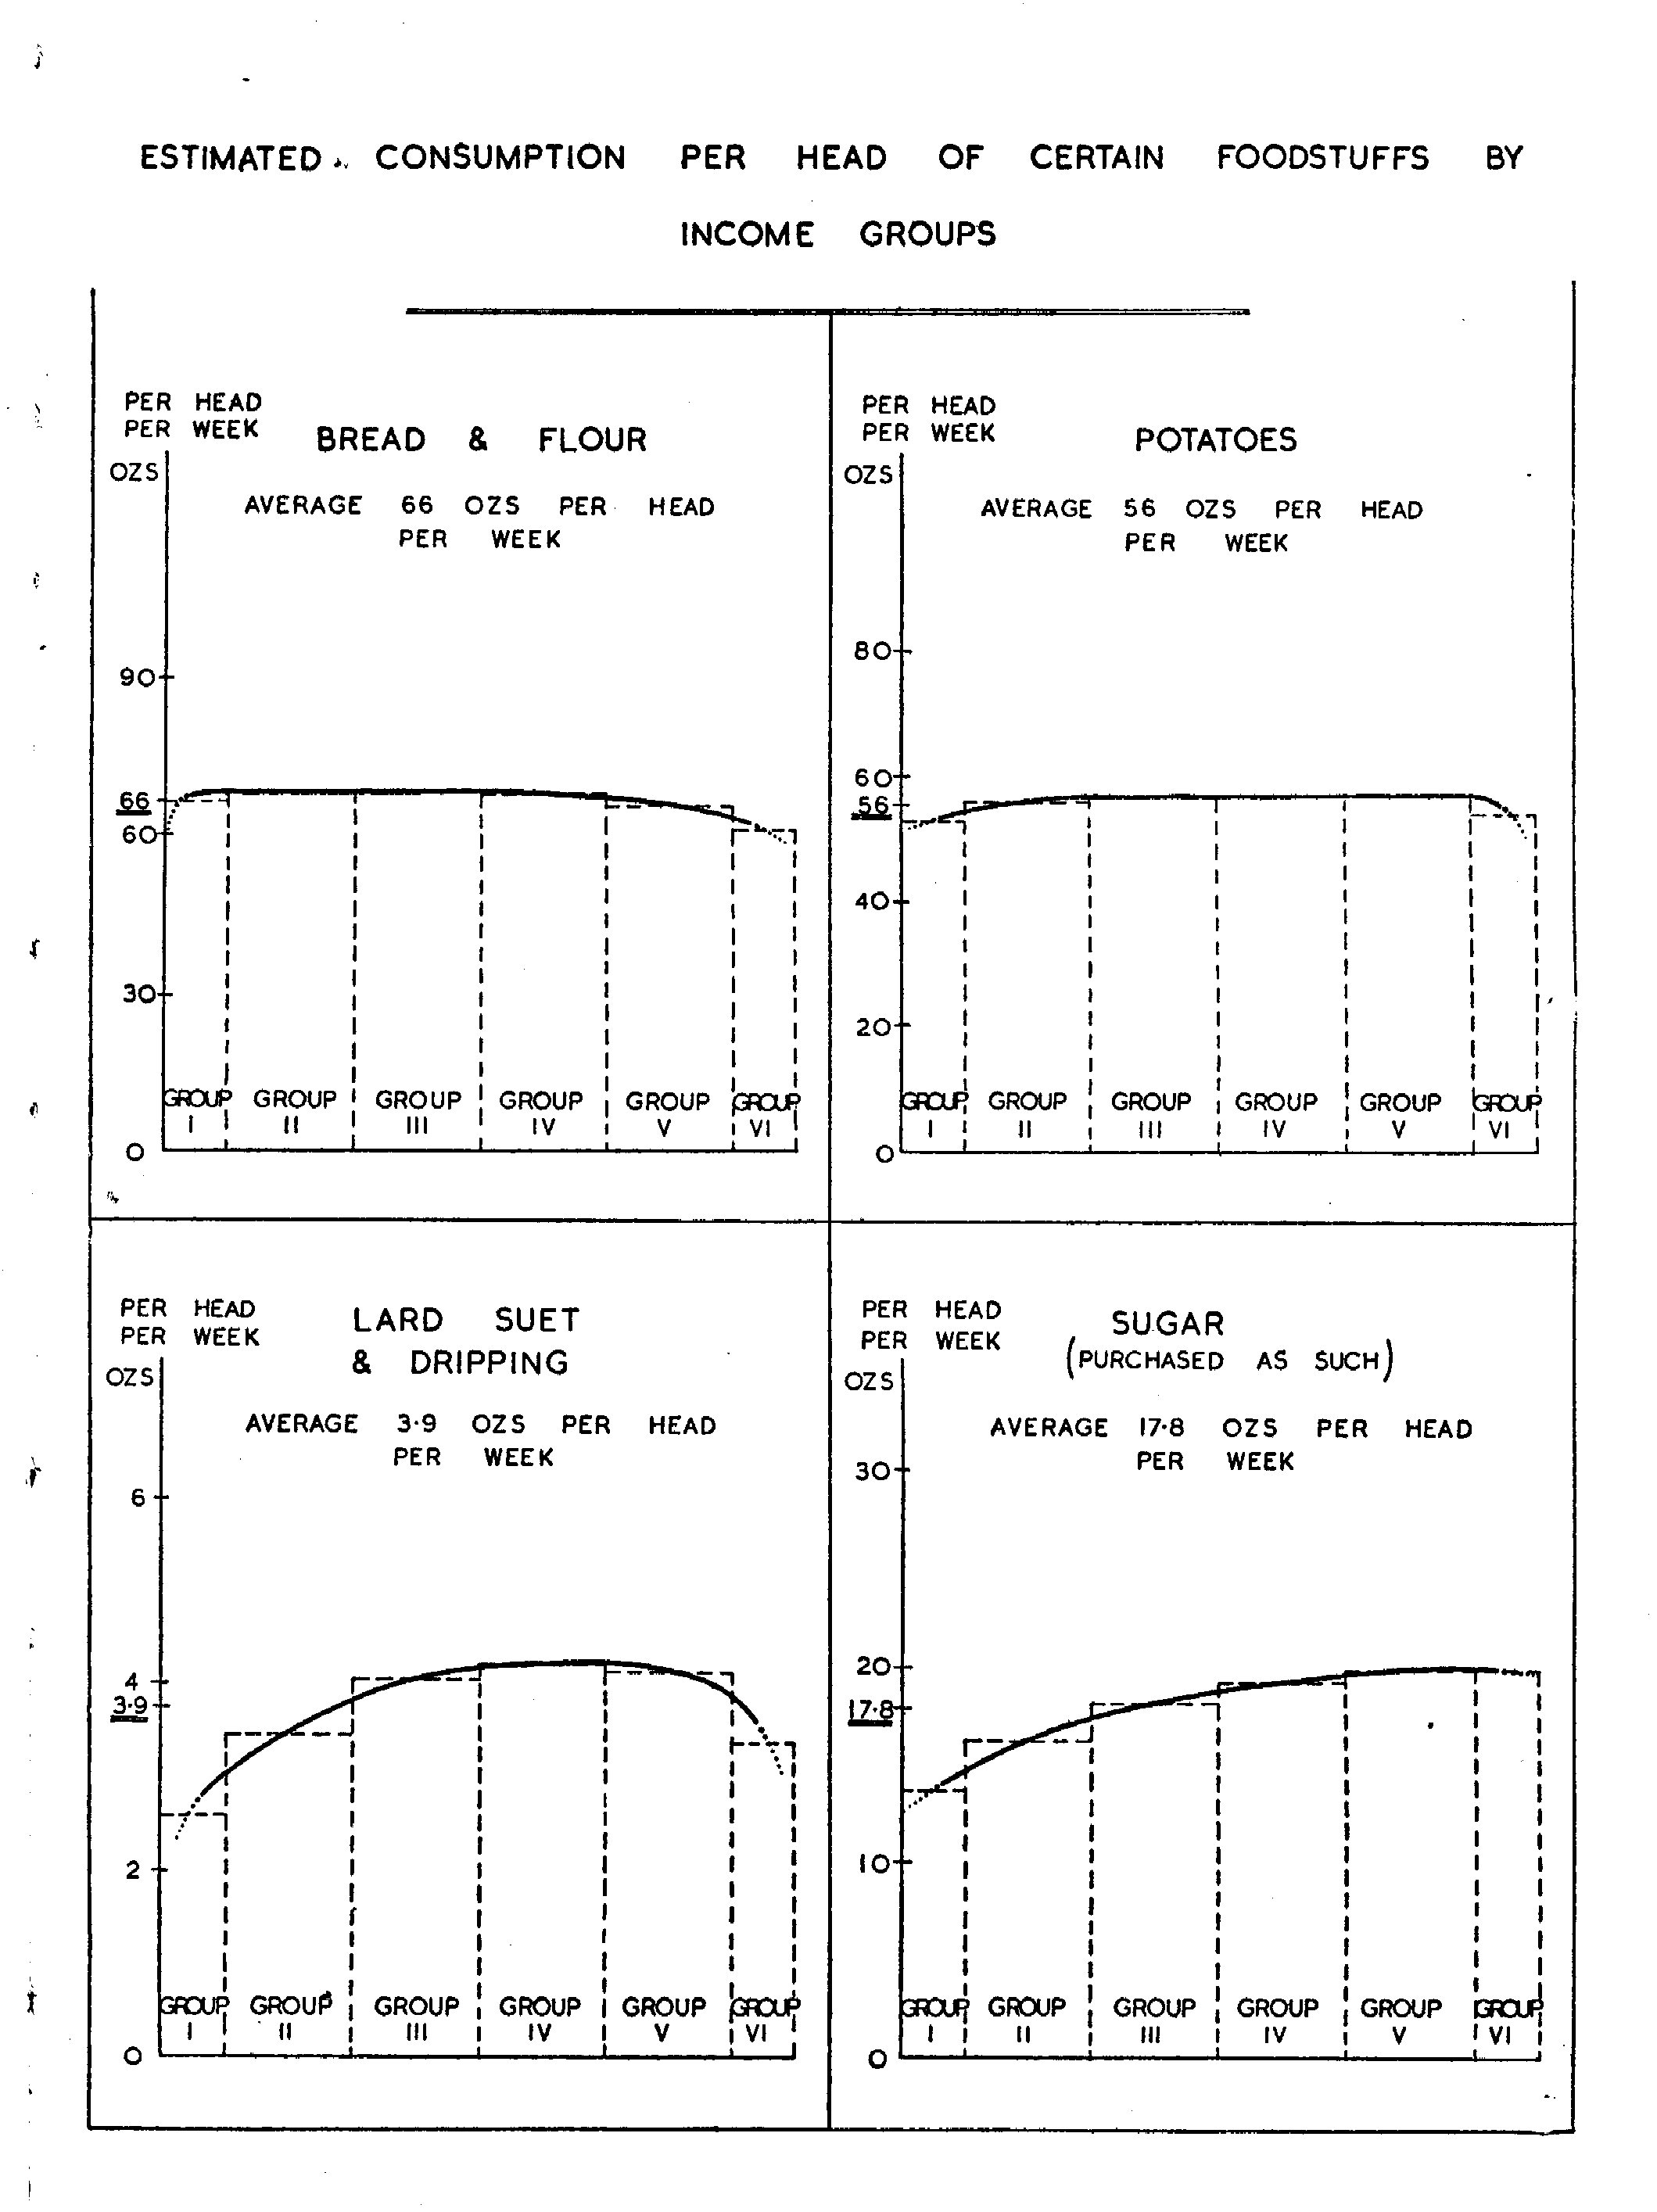
The consumption of potatoes and flour is remarkably uniform in all the groups except I and VI, the lowest and the highest, in both of which it is slightly lower than in the four middle groups, which comprise 80 per cent, of the population. In the highest income group there is evidence that more expensive foods are substituted for potatoes and bread. The inclusion of cakes and biscuits brings the curve for flour considerably above what it would have been for bread alone in the highest groups. The curves for the expensive foodstuffs, e.g., milk and eggs, rise steeply in group VI. In the lowest group there is no indication of any substitution, nor indeed is there any cheaper food which could be substituted for potatoes and bread. It looks as if either the purchasing power of this group is so low that the consumption of even the cheapest foodstuffs is limited, or, what is more probable, the appetite in the lowest income group is below the average. One of the first signs of sub-optimal nutrition is diminished appetite.
Cheese and the fats—lard, suet and dripping—reach their highest consumption in the middle groups. The falling off in the consumption of lard, suet and dripping in the two upper groups may be due to the substitution of butter for cooking purposes, and the falling off in the consumption of cheese in the two upper groups to the substitution of other foodstuffs, the consumption of which is higher in these.
The graphs for margarine and butter show that as income rises there is a change over from margarine, which is cheaper, to butter. When butter, margarine, lard, suet and dripping are grouped together, it is found that the total fat consumption rises steadily from 10-2 ounces in group I, to 15-8 ounces in group VI.
The consumption of all the other foodstuffs shown in the graphs rises with income. Thus in the case of liquid milk the average consumption for the whole population is taken at 3.1 pints per head per week. This figure, which is based on the estimated number and yield of cows, is 10 per cent, in excess of the estimate made by the Milk Marketing Board, which is only 2.8 pints per head per week. In the lowest group the average consumption is 1.1 pints and in the highest 5-5 pints. The small consumption of liquid milk in the lower groups is partly compensated for by a greater consumption of condensed and dried milk. Taking all kinds of milk in terms of the equivalent of liquid milk, consumption per head per week is as follows : group I, 1.8 ; group II, 2.7 ; group III, 3.1 ; group IV, 3.6 ; groups V and VI combined, 5 pints.
All kinds of fruits were considered together and the same procedure was followed in the case of vegetables. The graphs show not the actual quantities purchased, but the expenditure on these commodities. Fruit shows the steepest gradient, expenditure rising from 2.5 d. per head per week in group I to 20d. in group VI.
When all the foodstuffs are considered together, it is seen that in group I, comprising 4.5 million people, total food consumption is low and includes mainly cheap suppliers of energy and therefore cheap satisfiers of hunger, e.g., potatoes, bread, margarine. The consumption of more expensive foodstuffs, e.g., liquid milk, eggs, fruit, vegetables, meat, rises progressively with income, the increase being superimposed upon a relatively constant quantity of bread and potatoes.
EXTENT TO WHICH CONSUMPTION CAN BE INCREASED.
In view of the desirability of increasing consumption it is of interest to estimate the additional amounts of the various foodstuffs which would be required to raise consumption of the lower groups to that of the higher. Table 5 shows the increase in consumption needed to bring that of the lowest group up to that of the second, the lowest two up to that of the third, the lowest three up to that of the fourth and so on.
Group VI represents a level at which price fluctuations have little effect on consumption. This, therefore, may be taken to represent roughly saturation point for the staple foods. It gives an indication of the highest level to which consumption could be raised under the present food habits of this country.
| Percentages |
|
|
Groups I-III to Group IV | Groups I-IV to Group V | All Groups to VI | ||
|---|---|---|---|---|---|---|---|
| Milk | 3 | 8 | 16 | 42 | 80 | ||
| Butter | 4 | 8 | 15 | 24 | 41 | ||
| Eggs | 2 | 7 | 18 | 27 | 55 | ||
| Fruit* | 2 | 9 | 25 | 53 | 124 | ||
| Vegetables* (excluding potatoes) | 2 | 9 | 25 | 47 | 87 | ||
| Meat | 2 | 7 | 12 | 18 | 29 | ||
| Margarine | -4 | -16 | -26 | -37 | -48 |
*Based on expenditure: increase in quantity would not necessarily be the same figure
