This is NHS Check report no 6 originally published by Labour’s Shadow Health Team in January 2013
Not safe in his hands: A&E under David Cameron
Revealed: Worst winter in the NHS for almost a decade as cuts, under-staffing and reorganisation leave A&E services on the brink
Before the election, David Cameron said the NHS was safe in his hands. However, Accident and Emergency units have seen performance deteriorate significantly this winter. Labour has uncovered new evidence to show to patients are suffering delays at every stage of emergency:
- More ambulances missing 8 minute arrival target
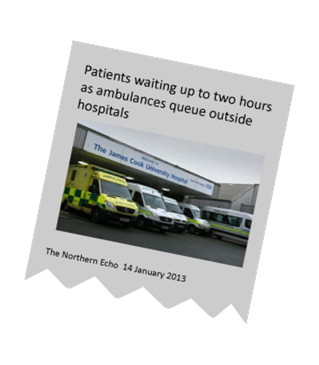
- Patients waiting for hours in the back of ambulances
- More patients waiting more than four hours in A&E
- Patients waiting hours on trolleys for hospital beds
- A&E waiting times are the worst in almost a decade and Government has missed its own reduced target for A&E patients for the last 17 consecutive weeks with only 94.7% of patients being seen within four hours so far this year
- An extra 47,000 patients so far this winter have waited more than 4 hours in A&E compared to last winter, NHS data confirms
- Over 100,000 extra patients have now waited longer than 4 hours for treatment in A&E since the start of the NHS 2012/13 year
- Patients are waiting longer on trolleys – new year-to-date figures show an extra 23,000 waited longer than four hours on trolleys to be admitted than in 2011/12.
- Delayed discharges from hospital have risen by 15% above 2010 figures
- The health care regulator, the Care Quality Commission, has warned that 17 hospitals are under-staffed and cannot guarantee patient safety. 5,000 nursing jobs have been lost since David Cameron entered Downing Street.
The official figures are bad enough. But they do not tell the full story of the pressure on England’s emergency service. A new survey by Labour of all ambulance trust reveals the scale of the chaos in A&E units.
Key findings as follows:
- An extra 10,400 patients were made to wait 30 minutes or more outside A&E units before being accepted by A&E compared with last winter – Paramedics warn of “dire” situation
- Patients, in some areas, are being made to wait in ambulances for five over hours:
- In Great Western Ambulance Trust a patient waited 5 hours and 42 minutes
- In West Midlands Ambulance Trust a patient waited 5 hours and 5 minutes
- In Southern Central Ambulance Trust a patient waited 4 hours and 56 minutes
- With ambulances tied up in queues, fewer than 7 in 10 ambulances, in some regions, are reaching the most serious call outs within the 8 minute arrival time target
- Paramedics warn services on brink of crisis:
- “Families of sick people arrive at hospitals and expect to find them in a bed, but they are still outside in an ambulance. The frustration of ambulance staff is beyond belief”
Paramedic in the North East
- “Someone will die this winter as a result of no ambulance being available at the time of the emergency. It is not a matter of if, but when” Paramedic in Hertfordshire
Labour calls on David Cameron to:
- Ensure that every NHS trust is sufficiently staffed in order to provide safe care through the winter and develops a plan to bring all A&Es back up to national standards
- Calls on David Cameron to drop plans to close Lewisham A&E and other reconfigurations where a sound clinical case has not been made.
A&E
The NHS is in the midst of the worst winter in nearly a decade. This report now reveals new evidence that shows that the full picture of A&E services is much worse than official figures suggest.
At every stage of a patient’s journey, waiting times are getting longer. Patients have to wait longer for an ambulance to arrive; patients have to wait longer in ambulances, outside A&Es; patients have to wait longer in A&E before being treated; patients have to wait longer on trolleys before being admitted.
New evidence in this report shows a system that is under extreme pressure from all angles. A&E departments are now on the brink.
A&E waiting times are the worst in almost a decade
A key barometer of patient experience is the waiting times they experience in A&Es. Since the election, we have seen a marked decline in the percentage of patients being seen within four hours.
The percentage of patients waiting longer than 4 hours in A&E has increased to levels not seen since 2003/04 and the trend shows that things are getting worse for patients. The trend line demonstrates this[1].
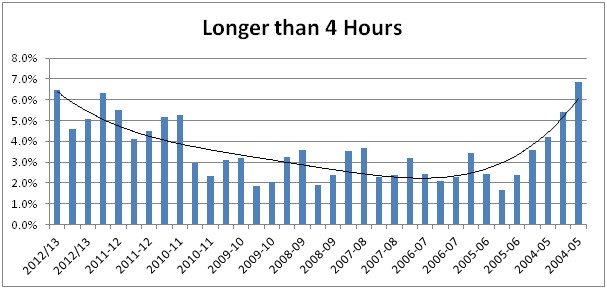
An extra 47,404 patients so far this winter have waited more than 4 hours in A&E compared to last winter, NHS data confirms.
|
Type 1 (Major Units) |
||
|
Autumn/Winter 2011/12[2] |
238,649 |
|
|
Autumn/Winter 2012/13[3] |
286,053 |
|
|
Difference |
47,404 |
This data shows the number of patients who have waited more than four hours from arriving at A&E to admission, transfer or discharge. This is a huge increase in the number of patients waiting longer than four hours (an increase of 20% on the previous year). This increase is unsustainable and is putting a major strain on services.
A Care Quality Commission report shows that 1 in 6 hospitals have inadequate staffing levels in A&E hospitals. A&E waiting times are a barometer of hospital performance as pressure anywhere in the hospital system creates a back up through A&E.
The national statistics show a worsening scenario, but there are many trusts that are underperforming these statistics. In some trusts, more than 1 in 4 patients are waiting longer than four hours. The table below shows the 10 worst performing trusts in the week ending 20th January 2013
|
A&E attendances > 4 hours from arrival to admission, transfer or discharge |
|
| Worst performing trusts in week ending 20/01/2013 | Percentage in 4 hours or less (type 1) |
| North West London Hospitals NHS Trust |
72.3% |
| Stockport NHS Foundation Trust |
78.0% |
| University Hospitals Of Leicester NHS Trust |
79.3% |
| Milton Keynes Hospital NHS Foundation Trust |
82.5% |
| Brighton And Sussex University Hospitals NHS Trust |
82.7% |
| County Durham And Darlington NHS Foundation Trust |
83.5% |
| University Hospital Of North Staffordshire NHS Trust |
84.2% |
| Buckinghamshire Healthcare NHS Trust |
84.9% |
| University Hospitals Coventry And Warwickshire NHS Trust |
85.0% |
| Ashford And St Peter’s Hospitals NHS Foundation Trust |
86.0% |
102,216 extra patients have waited longer than 4 hours for treatment in A&E since the start of the NHS 2012/13 year. This is an increase of 18.5% on 2011/12.
|
A&E attendances > 4 hours from arrival to admission, transfer or discharge[4] |
||||
|
Type 1 Departments – Major A&E |
Type 2 Departments – Single Specialty |
Type 3 Departments – Other A&E/Minor Injury Unit |
All |
|
|
Weeks 1 to 42 2012/13 |
642,515 |
1,598 |
8,092 |
652,205 |
|
Weeks 1 to 42 2011/12 |
541,018 |
1,858 |
7,113 |
549,989 |
|
Difference |
101,497 |
-260 |
979 |
102,216 |
This data reinforces the data already presented. More and more people are waiting more than four hours in A&E departments throughout England. This data is a real barometer of patient experience and the worsening data supports the anecdotal evidence that patients’ experiences are deteriorating.
The data below shows the increased number of patients waiting on trolleys after being seen at A&E.
23,736 extra patients are waiting longer than four hours on trolleys waiting to be admitted
| Number of patients waiting more than four hours (but less than 12) from decision to admit to admission[5] | |
| Weeks 1 to 42 2012/13 |
102,084 |
| Weeks 1 to 42 2011/13 |
78,348 |
|
Difference |
23,736 |
This demonstrates clearly that more people are being made to wait longer in A&E and afterwards are being made to wait longer before being admitted.
Delayed discharges from hospitals have risen by 15% above 2010 figures
Over the last two and a half years, the number of delayed discharges has increased by 15%. This is patients unable to leave hospital because there just aren’t the services that they need available in the community. As such, the increase in the delayed discharging of patients has meant that resources are being diverted in order to care for them when services should be available to allow these patients to return home.
|
Year |
Period |
Acute[6] |
|
2010-11 |
August |
55,332 |
|
2012-13 |
December |
63,743 |
This is compounded by the cuts to local services as a result of the reduction in council budgets. The National Audit Office has today published a report[7] detailing the level of expected cuts to social care services in local communities. As a result, the number of people who will have to remain in hospital due to a lack of community service will only continue to increase.
The statistics here show that the A&E departments throughout England are under pressure from every angle:
- More people are waiting more than four hours to be seen
- More people are waiting more than four hours to be admitted after the decision has been taken
- More people are kept in hospital because there aren’t services available to them outside of the hospital
New evidence obtained by Labour shows that the data above does not show the full extent of the pressure on the system. A Freedom of Information survey of all Ambulance Service Trusts in England has revealed some worrying trends. Some patients have had to wait in the back of an ambulance for over 5 hours after arriving at A&E before they can join the queue to be seen.
An extra 11,138 patients were made to wait 30 minutes or more outside A&E units before being accepted by A&E compared with last winter
The Department of Health have published weekly Situation Reports for the performance of key indicators in the NHS through winter.
One of these key indicators is the number of ambulances queuing for 30 minutes or more outside of A&E unable to transfer their patients into the hospital. The table below shows the figures comparing winter 2011/12 with winter 12/13:
| Dates[8] | Number of Ambulances queuing[9] |
| 30 November 2012 to20 January 2013 |
42,950 |
| 2 December 2012 to22 January |
31,812 |
This shows that this winter there were 11,138 more ambulances waiting over 30 minutes outside A&E departments. This is an increase of 35% from the year before.
At Health Questions on 15 January 2013[10], Dr Dan Poulter MP, Parliamentary Under-Secretary of State for Health, responded to a question in parliament on ambulance delays. He called the practice unacceptable and yet the statistics show it is getting worse on his Government’s watch.
This extra 11,138 ambulances queuing for more than 30 minutes equates to an extra 214 patients every day waiting for longer for treatment. This is in addition to the waiting longer to be seen once inside A&E departments. This trend is unsustainable and A&E departments need to have the staffing levels to allow them to cope with number of patients that require treatment.
Patients, in some areas, are being held in the back of ambulances outside A&Es for more than 5 hours.
New data obtained by the Labour Party have shown that some patients are waiting for hours in the back of Ambulances because of the lack of capacity at A&E departments.
Freedom of Information requests from Ambulance Trusts[11] have revealed the longest wait experienced by a patient before being able to enter A&E from arriving there:
| Trust Name | Longest wait experienced by a patient |
| West Midlands Ambulance Service NHS Trust | 5 Hours, 5 Minutes – Solihull |
| Southern Central Ambulance Service NHS Trust | 4 Hours, 56 Minutes |
| South West Ambulance Service NHS Trust | 3 Hours, 38 Minutes |
| Yorkshire Ambulance Service NHS Trust | 3 Hours, 48 Minutes |
| East Midlands Ambulance Service NHS Trust | 2 Hours, 53 Minutes |
| Greater West Ambulance Service NHS Trust | 5 Hours, 42 Minutes |
| London Ambulance Service NHS Trust | 2 Hours, 34 Minutes |
These numbers are not included in A&E waiting times data. This means that patients have to wait for up to nearly six hours before being discharged into A&E and then they have to wait in A&E until they are treated. This shows that the increase in A&E data does not show the full story of patient experience i.e. patients are waiting for longer and longer to get into A&E and then have to wait longer and longer in A&Es.
Paramedics and other staff are concerned about the state of the service that they are able to offer. One paramedic in the North East said:
“Somebody is going to die somewhere down the line and it could be the most vulnerable, children. Families of sick people arrive at hospitals and expect to find them in a bed, but they are still outside in an ambulance. The frustration of ambulance staff is beyond belief”[12]
Another paramedic in Hertfordshire said:
“I can only see things becoming more dire. Someone in South Hertfordshire will die this winter as a result of no ambulance being available at the time of the emergency. It is not a matter of if, but when”[13]
In some regions, fewer than 7 in 10 ambulances are reaching the most serious call outs within the 8 minute target
Ambulances are expected to arrive at 75% or more Category A (most serious) call outs within 8 minutes of being called. Some Ambulance services throughout the country are failing to meet this standard:
| Trust Name | Percentage of ambulances reaching Cat. A call outswithin 8 minutes | Change from previous year |
| Southern Central | 74%[14] | No Change |
| Yorkshire | 68.5%[15] | Down 4% |
| East Midlands | 69%[16] | Down 4% |
| London | 67%[17] | Down 5% |
Because more ambulances are being made to queue outside hospitals with patients, it means there are fewer available to respond to emergencies. As a result, trusts throughout England are unable to meet their response targets for the most serious call outs.
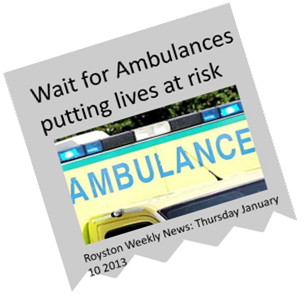
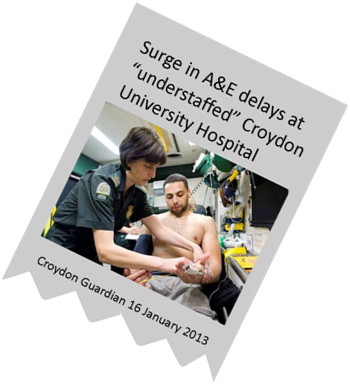
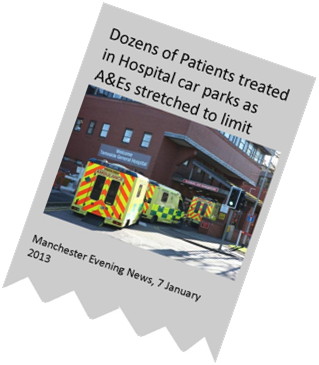
These are pressures that are being felt throughout the country. Local newspapers are full of examples of stories of ambulances queuing:
 Conclusion
This report paints a picture of overstretched and understaffed A&Es having a serious knock on effect on ambulance services.
Patients are waiting hours in A&E or being held up in ambulance queues outside. Ambulances are failing to reach the most serious call outs within the 8 minute target and paramedics are warning that services are on the brink.
The first priority for David Cameron must be to ensure all A&Es can provide safe care.
The CQC’s state of care report from December found that 16% of hospitals had failed to meet the CQC standard of having adequate staffing levels. The report warned that: “Ensuring there are enough staff to provide a good service is a significant issue in many services.”[18]
Labour calls on David Cameron to ensure all A&E are sufficiently staffed in order to provide safe care through the winter and develop a plan to bring all A&Es back up to national waiting time standards.
Secondly, rushed reconfigurations are being brought forward across the country without sufficient regard for A&Es and other services.
There is growing evidence of hospitals destabilised as hospitals find it harder to function and stand on their own two feet following the reorganisation. Financial concerns are taking precedence over clinical issues, as we are seeing in Lewisham where an A&E unit is being closed through a back-door reconfiguration to solve the financial problems of a neighbouring trust.
If any A&E is to be closed it is essential that a full clinical review takes place. No A&E should be closed on cost grounds alone.
Labour calls on David Cameron to drop plans to close Lewisham A&E and any others where a sound clinical case has not been made.
[1] Source: Weekly SitReps 2012/13 http://transparency.dh.gov.uk/2012/06/14/weekly-ae-sitreps-2012-13/
[2] Week ending 25/9/2011 to week ending 8/1/2012
[3] Week ending 23/9/201 to week ending 6/1/2013
[4] Source: Weekly SitReps 2012/13 http://transparency.dh.gov.uk/2012/06/14/weekly-ae-sitreps-2012-13/
[5] Source: Weekly SitReps 2012/13 http://transparency.dh.gov.uk/2012/06/14/weekly-ae-sitreps-2012-13/
[6] The figure is by comparing the figures for December 2012 to August 2010 (this is when the data was first collected). These figures are for ‘acute delays’ and can be found here: http://transparency.dh.gov.uk/2012/07/11/delayed-transfers-of-care-2012-13/
[7] http://www.nao.org.uk//idoc.ashx?docId=45a00b55-dbc9-4281-88b8-cddef919b1db&version=-1
[8] Time periods are different as Department of Health data is aggregated at weekends and so a comparable time period has been chosen i.e.52 days long starting and ending on weekends
[9] Data taken from Daily SITREP reports published at http://transparency.dh.gov.uk/2012/10/26/winter-pressures-daily-situation-reports-2012-13/
[10] House of Commons Hansard, 15 January 2013, Column 729
[11] Freedom of information requests were submitted to 11 Ambulance trusts. Responses were received from 7
[12]http://www.darlingtonandstocktontimes.co.uk/news/10158697.Anger_over_queues_of_ambulances_outside_hospitals/?ref=twtrec
[13]http://www.stalbansreview.co.uk/news/10141519.Paramedic_says_ambulance_service_is_in__state_of_collapse_/
[14] Data supplied from FOI response is from 1st November to most recent data available. Southern Central did not indicate the most recently available date from which the data was drawn.
[15] This data is taken from the figures supplied by the FOI response and is data for December 2012
[16] Data range: 1st November 2012 to 31st December 2012
[17] Data range: 1st December 2012 to 18th December 2012
[18] CQC State of Care Report 2012 http://www.cqc.org.uk/media/cqc-launch-state-care-report-2012