Fabian occasional paper 8
This paper is based on the sixth Somerville Hastings memorial lecture delivered at Ruskin College, Oxford on the 7 March 1974 by Sir Richard Doll, Regius Professor of Medicine at Oxford University. The lecture was endowed by the Socialist Medical Association.
This pamphlet, like all publications of the Fabian Society, represents not the collective view of the Society but only the view of the individual who prepared it.
Fabian Society, 11 Dartmouth Street, London SW1H 9BN.
November 1974 ISBN 7163 3008 3
INTRODUCTION
Few people who were not members of the organisations in which Somerville Hastings worked can have any appreciation of the contribution he made to British medicine, for he always preferred the background and was completely devoid of ambition, save for the welfare of the bodies which he served. These, however, were many—the Socialist Medical Association, the constituencies of Reading and Barking, the London County Council, and the Middlesex Hospital. In these changed days, it is difficult to appreciate the uniqueness of his character. It is not just that he was a consultant who was in favour of the NHS in 1948, but, as an ENT surgeon at a London teaching hospital, he belonged to a group of ultra-specialists who were more closely identified with private practice than most other sections of the profession. Such men were seldom scientists, yet Hastings had won a gold medal at University College for botany and had been a cancer research scholar before taking his higher surgical degrees. They never entertained revolutionary students, nurses, and other health workers in their homes, yet Hastings invited them all to his home in Harley Street, gave them drinks (despite being a teetotaller) and persuaded them, by example, to work together, irrespective of faction. Those of us who were members of the Socialist Medical Association before the war knew him to be the father of the NHS and it is a great privilege to give a lecture in his honour.
Monitoring The Service
ANNUAL DEATH RATES IN 17 COUNTRIES : 1948, 1958 and 1969.
| country infant mortality per 1,000 live births 1-4 years1948 1958 1969 1948 1958 1969 | mortality per 100,000 persons aged :5-24 years 25-44 years1948 1958 1969 1948 1958 1969 | 45-64 years1948 1958 1969 | |||||||||||||
| Australia | 27.8 | 20.5 | 17.9 | 1.8 | 1.2 | 0.91 | 0.95 | 0.78 | 0.72 | 2.35 | 1.78 | 1.82 | 13.0 | 11.2 | 11.2 |
| New Zealand | 27.5 | 23.4 | 16.9 | 2.4 | 1.6 | 1.02 | 1.28 | 0.76 | 0.68 | 2.26 | 1.73 | 1.75 | 11.0 | 9.5 | 10.7 |
| Japan | 61.7 | 34.5 | 14.2 | 10.9 | 3.0 | 1.09 | 3.55 | 1.18 | 0.65 | 7.03 | 2.73 | 1.83 | — | 12.3 | 9.1 |
| Canada | 44.4 | 30.2 | 19.3 | 2.4 | — | 0.89 | 1.10 | 0.73 | 0.74 | 2.45 | 1.83 | 1.70 | 11.9 | 10.9 | 9.9 |
| USA | 32.0 | 27.1 | 21.0 | 1.6 | 1.1 | 0.84 | 1.05 | 0.75 | 0.86 | 3.00 | 2.25 | 2.41 | 14.5 | 12.6 | 12.0 |
| Belgium | 59.1 | 31.3 | 21.2 | 2.6 | 1.2 | 0.96 | 1.28 | 0.68 | 0.65 | 3.20 | 1.75 | 1.66 | 13.4 | 10.9 | 11.0 |
| Denmark | 35.3 | 22.4 | 14.8 | 1.8 | 0.8 | 0.71 | 0.85 | 0.53 | 0.56 | 2.18 | 1.50 | 1.48 | 9.6 | 9.1 | 9.0 |
| Finland | 51.9 | 24.5 | 14.3 | 3.7 | 1.6 | 0.80 | 2.35 | 0.68 | 0.63 | 4.70 | 2.45 | 2.34 | 14.9 | 13.0 | 12.8 |
| France | 55.9 | 27.1 | 16.4 | 3.1 | 1.4 | 0.85 | 1.20 | 0.63 | 0.70 | 3.25 | 2.10 | 2.02 | 12.0 | 10.7 | 10.3 |
| Germany fr | 68.1 | 36.0 | 23.4 | 3.4 | 1.4 | 1.04 | 1.53 | 0.78 | 0.76 | 3.15 | 1.93 | 1.87 | 11.0 | 10.6 | 10.5 |
| Great Britain | 35.5 | 23.0 | 18.3 | 1.8 | 0.9 | 0.79 | 1.05 | 0.53 | 0.50 | 2.41 | 1.60 | 1.46 | li.9 | 11.3 | 11.0 |
| Iceland | 26.2 | 18.7 | 11.7 | 2.0 | 1.4 | 0.73 | 1.20 | 0.70 | 0.57 | 3.28 | 1.53 | 1.83 | 9.2 | 8.4 | 8.5 |
| Italy | 72.1 | 48.2 | 30.8 | 6.8 | 2.5 | 1.07 | 1.60 | 0.75 | 0.61 | 3.10 | 1.83 | 1.60 | 11.3 | 10.0 | 9.9 |
| Netherlands | 29.3 | 17.2 | 13.2 | 2.0 | 1.2 | 0.91 | 0.88 | 0.55 | 0.55 | 1.83 | 1.30 | 1.30 | 8.9 | 8.2 | 8.7 |
| Norway | 29.6 | 20.0 | 13.8 | 2.1 | 1.1 | 0.91 | 1.10 | 0.60 | 0.58 | 2.33 | 1.38 | 1.39 | 8.2 | 8.0 | 8.3 |
| Sweden | 23.2 | 15.9 | 11.6 | 1.3 | 0.9 | 0.56 | 0.88 | 0.55 | 0.52 | 2.05 | 1.43 | 1.44 | 9.8 | 8.2 | 7.8 |
| Switzerland | 35.9 | 22.2 | 15.3 | 2.2 | 1.3 | 0.93 | 1.10 | 0.78 | 0.64 | 2.55 | 1.63 | 1.52 | 12.3 | 9.7 | 8.8 |
Medical Outcome
Consider first medical outcome. This, we have been accustomed to judge by the extent to which we succeed in preventing or curing disease, and in relieving disability. We have been urged by the World Health Organisation to seek instead to increase “physical, mental and social well-being”, but the scales that have been devised are too artificial to be of any practical value. With Bradford Hill, I suspect that positive health is as impossible to measure as love, beauty, and happiness. Indeed we are only just beginning to measure morbidity, and we still have to rely to a large extent for the assessment of medical outcome on the old measure of mortality which has the advantage of being unequivocal and of overriding importance to the individual, I shall return to this problem later when considering economic efficiency, but meanwhile shall assume that changes in mortality and morbidity are the only practical measures available.
Mortality: international comparisons
How, then, has Britain progressed in the years since the health service was introduced in comparison with other countries which have depended on other systems, by the simple objective criterion of total mortality? There are few things more frustrating than trying to make international comparisons of mortality rates over a period of time. The figures needed are often missing for particular years or are given for different age groups, and the population base is changed by the inclusion or exclusion of particular ethnic or geographical groups. We can, however, make comparisons between the mortality rates for all causes in five broad age groups over the years 1948 to 1969 in 17 countries. For this purpose I have regarded England, Wales and Scotland as one country and have combined the published rates in one set of figures. Had they been considered separately the results would have looked somewhat better for England and Wales and somewhat worse for Scotland, but the trends would have been similar. The results are shown above.
The infant mortality rate, which has long been regarded as a sensitive indicator of the combined effect of social conditions and health services, fell in Great Britain by 48 per cent. This is quite impressive until we note the much greater fall in Japan. In fact the British position deteriorated from ninth among the 17 countries to twelfth. Between ages 1 and 44 years the British rates did better, maintaining or improving their position and, indeed, becoming the lowest in all the 17 countries for the youthful ages of 5 to 24 years. In middle age few countries have shown much improvement, the average decline being about 10 per cent. In Britain the decline was only 8 per cent and the British position deteriorated again from ninth to thirteenth.
In the five age groups I have examined, Sweden now occupies one of the first four places in all; the Netherlands in four, and Norway, Iceland and British each in three. Despite the great contributions of American medicine, the position of the United States has worsened in all, becoming respectively sixth, fourteenth, sixteenth, seventeenth and seventeenth out of the 17 countries (the last two at ages 5-24 and 25-44 years).
At older ages, crude mortality rates provide an unsatisfactory measure and it is better to substitute the expectation of life at 65 years, Unfortunately, few such figures are available, but those that there are show that Britain compared unfavourably with most other countries and continues to do so.
Total mortality rates are a tough criterion to apply to a health service, as they depend largely on cultural, economic, and environmental conditions that are not easy to control. For example, the rise in mortality at ages 5 to 44 years that took place in the USA between 1963 and 1968 can be attributed to an increase in motor accidents, suicides, homicides and cirrhosis of the liver without postulating a decrease in the effectiveness of medical care (“Leading components of upturn in mortality for men. United States 1952-67, Vital and Health Statistics, series 20 number 11, us Government Printing Office). The health services, however, can no more ignore these causes of death and the effects of cigarette smoking and over nutrition than they could ignore the role of polluted water in the nineteenth century.
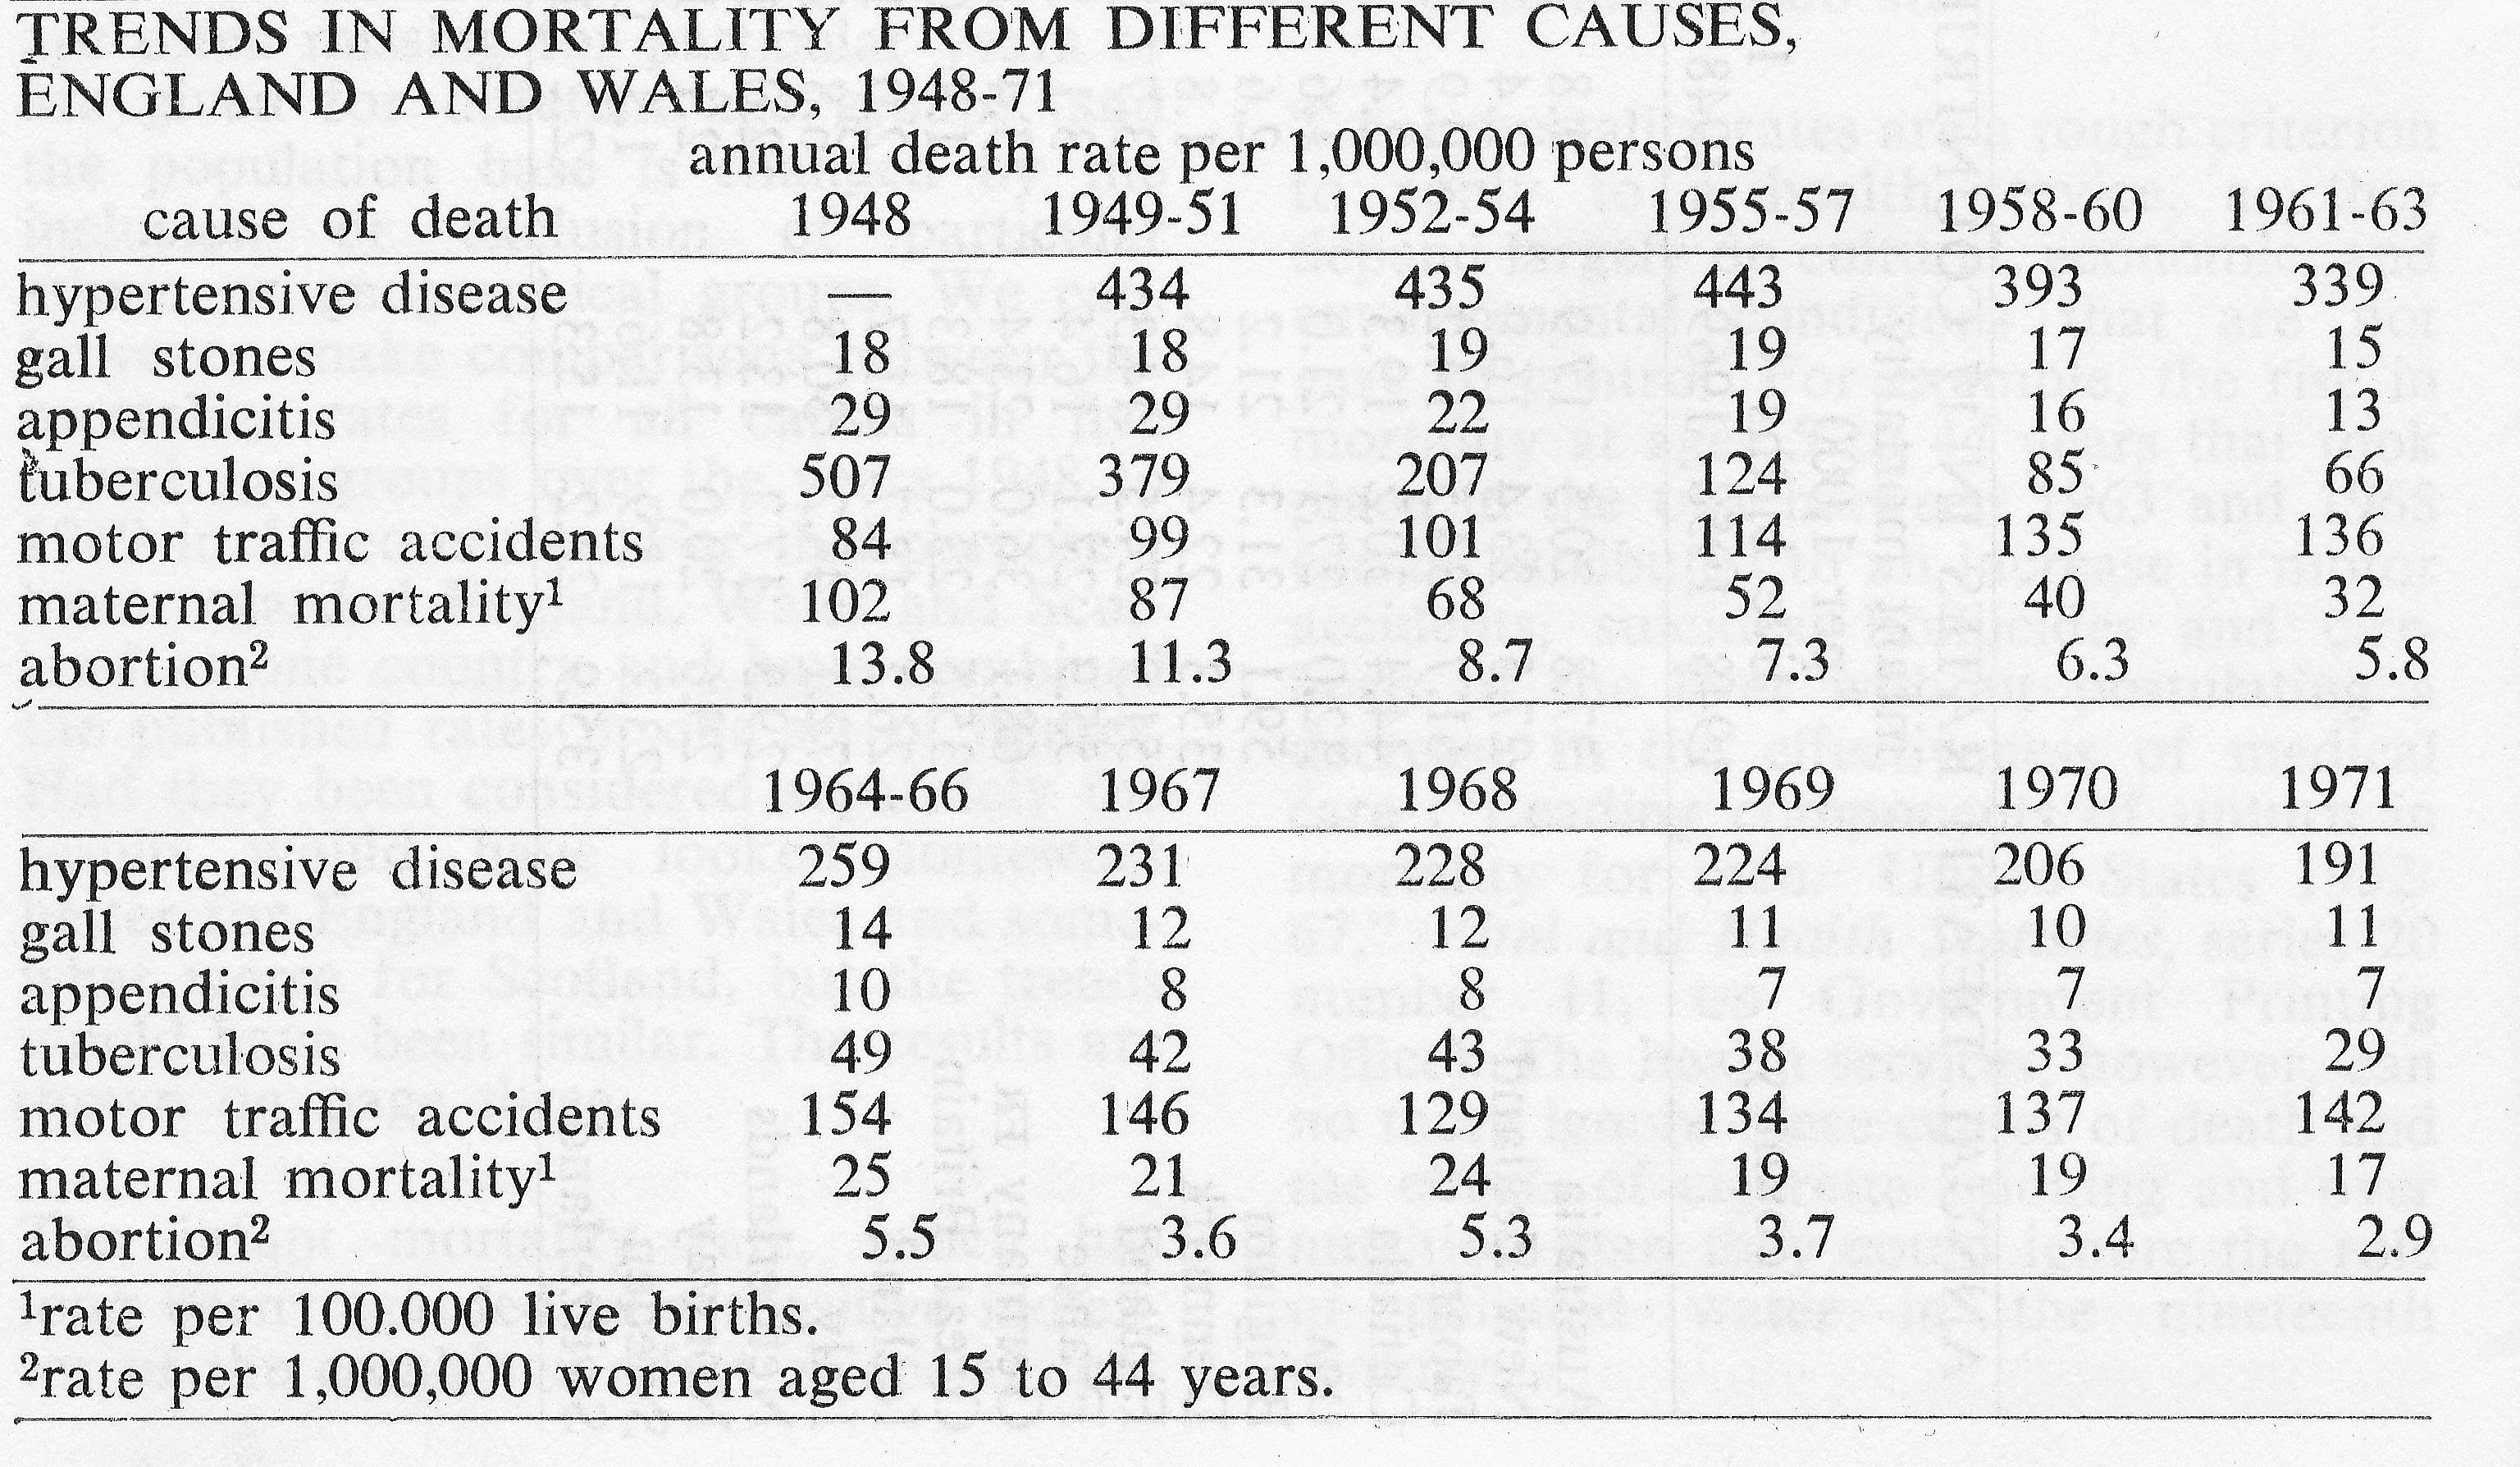
TRENDS IN MORTALITY FROM DIFFERENT CAUSES, ENGLAND AND WALES, 1948-71
Specific mortality within Britain
Much more can, of course, be learnt from examining the mortality from specific diseases, something that is particularly easy to do in Britain thanks to the detailed publications of the Office of Population Censuses and Surveys. These data are used regularly by the Chief Medical Officer of the Department of Health and Social Security to measure the effect of medical intervention, and are too well known to require amplification. A few examples only are provided in the table below.
The mortality from hypertensive disease, gall stones and appendicitis has fallen slowly and progressively due presumably to improvements in treatment and the facilities for it, as incidence rates are unlikely to have diminished.
The mortality from tuberculosis fell dramatically from 507 in 1948 to 97 per million in 1958 and has continued to fall since, till it is now (29 per million) only a little more than that for asthma (24 per million). The decrease in the number of deaths is unfortunately compensated for by the increase in the number attributable to cancer of the lung, from 231 per million in 1948 to 623 per million in 1971. The overall level of the mortality from motor traffic accidents, which is one of the lowest in Europe, and the relative constancy of the rate in the last 12 years, despite the great increase in traffic, is a tribute to the efforts that have been made to prevent accidents and to the efficiency of the accident service. A 20 per cent reduction occurred in the year following the introduction of the breathaliser and the setting of an upper limit to the permissible amount of alcohol in the blood; but the rate has been increasing slowly since. The reduction in 1962 was due almost entirely to a reduction in motor cycle accidents, as drivers turned for preference to cars.
The maternal mortality has been falling steadily and is now only a sixth of what it was in 1948. In 1971 only 134 deaths were attributed to complications of pregnancy, childbirth and the puerperium; including 27 attributed to abortion. This last is about half the number that was recorded annually before the Act was passed which legalised abortion for social reasons, but it is difficult to be sure whether this is because of a decrease in the total number of abortions or an increase in their safety.
Local fatality rates
Much can also be learnt by comparison of mortality rates in different parts of the country. Such comparisons have often been used to obtain clues to causation, but hardly at all to examine the effectiveness of the service. With the development of hospital activity analysis we can now begin to study case fatality rates in different areas and units thus avoiding the difficulty of geographical differences in incidence. Heasman and Carstairs (personal communication) for example, used hospital data to compare the results obtained for a number of common surgical conditions in teaching hospitals and non-teaching hospitals throughout Scotland. In contrast to a study that had been carried out by Lee and his colleagues 16 years earlier in England, fatality rates for appendicitis and peptic ulcer were practically identical in both types of hospital (Lee, Morrison and Morris, “Fatality from three common surgical conditions in teaching and non-teaching hospitals”, Lancet, 2, 1957). The fatality of hyper-plasia of the prostate, however, was again higher outside the teaching hospitals (4.3 per cent against 3.3 per cent). Further investigation showed that the difference was due, not so much to the type of hospital, but to the presence of specialists— the results obtained by urological surgeons (2.3 per cent) ‘being appreciably better than those obtained by general surgeons (3.9 per cent), even after taking account of the fact that the general surgeons tended to operate on a higher proportion of old patients and of patients admitted as an emergency.
The data obtained from hospital activity analysis can provide many similar comparisons but they are not easy to interpret and special enquiries are often needed before conclusions can be drawn. One difficulty is that the data refer to admissions and not to persons or events. Ache-son (personal communication) for example, found that the fatality associated with a fractured neck of the femur was 11 per cent and 23 per cent respectively in two hospitals in the same region. Further enquiry showed that patients were discharged from one hospital sooner than from the other and that the first appeared to have better results because half their patients who died, died at home or in another hospital to which they had been transferred. The results at similar times after the event were, in fact, almost identical for each. Acheson was able to show this because he had developed a system in the Oxford region for linking together in a single record the different medical events of a patient’s life, irrespective of where or when they occurred; and we shall need to develop a similar system for the country as a whole if we are to make any serious attempt to assess the results of the component parts of the service.
Controlled trials
Another difficulty is that a new facility tends to attract a new range of patients, so that the results may appear to improve because the type of patient has changed. Doctors have recognised this in relation to the evaluation of new drugs and new vaccines, and to a lesser degree in relation to new operations; and have, therefore, accepted the need to examine the effect of new treatments by means of controlled trials with random allocation of different treatments to different patients. It is still not widely accepted, however, as a means of evaluating new and expensive services, such as the provision of coronary care units or coronary ambulances, despite the fact that it is the value of these services that needs to be most precisely measured. Consider, for example, the provision of a screening service for premalignant conditions of the cervix uteri. The pathological arguments that lead one to believe that the detection and removal of carcinoma-in-situ would prevent subsequent disability and death from cancer are strong; but they are not conclusive. Examination of the trend in mortality in British Columbia, where screening has been conducted energetically since the 1950’s, shows a decline in the rate that is very little different from that in other parts of Canada where screening was introduced later and much less intensively. The possibility remains, therefore, that the most fatal types of cancer develop rapidly without going through a prolonged pre-malignant phase or that women who delay reporting symptoms until the disease is too far advanced for effective treatment are also resistant to the blandishments of screening campaigns.
If screening is really effective, we must try to ensure that the service reaches the women who need it by, for example, routine examination of all those who are admitted to hospital, in the same way as routine x-rays of the chest were arranged when we had a national campaign to reduce the incidence of tuberculosis. To arrange this in the form of a controlled trial requires cool thought and skilled organisation. It would not be easy, but it was done with notable success in relation to the fluoridation of water (“The fluoridation studies in the uk and the results achieved after eleven years”, Reports on Public Health and Medical Subjects, number 122, hmso, 1969) and there is no inexorable reason why it should not also be done with clinical services. If practising doctors can carry the onus of deciding to allocate treatment to individual patients at random, before the general introduction of a new drug, medical administrators should be prepared to allocate services similarly to different areas for a trial period before providing them for the country as a whole.
Morbidity rates
So far I have concerned myself entirely with mortality, and I have done so intentionally because it must remain a principal indicator of progress for many years to come. It has, however, two limitations which, demand that we should also attempt to measure morbidity and monitor progress by measuring the extent to which it is relieved.
First, as mortality is controlled, we are left with a proportion of young people whose life has been saved but whose enjoyment of it is limited ‘by physical or mental disability, the result of congenital abnormality, accident or disease. Secondly we have to deal with an ever increasing -proportion of old people who have accumulated heavy burdens of irreversible disability and whose mortality rates are difficult to influence because they are determined partly by genetic factors that limit longevity and partly by the experience of the whole of their previous lives.
Unfortunately, we now come up against Finagle’s laws—propounded first in relation to radio communication but, as Professor Knon pointed out, equally pertinent to the field of medical care : (a) The information you have is not what you want (b) The information you want is not what you need (c) The information you need is not what you can obtain. Of these laws, the first is almost always true; but there are occasional exceptions to the second and third.
The information we have consists of a few facts about hospital discharges derived from hospital activity analysis, and about absence from work derived from claims for sickness benefit with their accompanying medical certificates.
The former are of little value for medical purposes, apart from the examination of fatality rates, until we can link together the events that affect an individual. Our other main source of information, sickness absence, is of almost no medical value at all, partly because the diagnoses, being on open documents, are often nonspecific and partly -because sickness absence is influenced by sociological and economic factors that have hardly begun to be investigated. Between 1954-5 and 1962-3, sickness absence, as measured by days of incapacity per person at risk standardised for age, remained practically constant, although the number of spells per 100 persons at risk increased by 22 per cent (see below). In the next six years, and particularly after 1966, both measures increased sharply. Decreases occurred in absence due to tuberculosis, pneumonia and appendicitis, while increases occurred in absence due to diabetes, arteriosclerotic heart disease, rheumatism, non-industrial accidents, and residual groups of infective and ill defined diseases. During this time unemployment increased and so did the scales of benefit, and it seems more likely that the increase was due to disclosure of previously hidden need or to a change in attitude to work than to an increase in disability (F. E. Whitehead, “Trends in certified sickness absence “, Social Trends, number 1, 1971). It was, at any rate, not just a British phenomenon, but was shared by other western European countries (P. J. Taylor, ” Some international trends in sickness absence”, British Medical Journal, number 4, 1969).
SICKNESS ABSENCE
rate standardised for age as per cent of rate 1954-5
all causes excluding influenza
- 1954-5 1962-3 1968-9
- days per person male 100 105 126
- days per person female 100 98 111
- spells per 100 persons female 100 121 145
- spells per 100 persons male 100 122 144
If, then, the information we have is not much help, what should we seek? The sort we have provides a measure of need that has been identified and more or less met. What we lack, or have in only rudimentary form, are two other measures: one of need that has been identified and met inadequately, the other of need that has not been identified at all. We have, of course, a record of people waiting for admission to hospital, but how many withdraw from the list to get treated, perhaps, elsewhere; and how many are never put on it at all until they have to be admitted as an emergency? How long do patients have to wait before an appointment can be arranged—with a general practitioner as well as with a consultant—and how often does a doctor not ask for a service that he would like to recommend because it is too difficult to obtain? How many old people are there at home incapacitated by arthritis, blind, or deaf, who could be relieved by an operation or a hearing aid; and how many come under medical care, whether general practitioner or consultant, and continue to have their symptoms unabated ? It is this sort of question that we ought to be able to answer, so that we can monitor the progress of the service by the progressive change in the extent of unmet need.
Occasionally, it may be possible to obtain answers from the records of a general practitioner, geriatric physician, or medical officer of health, but more often surveys are required of random samples of particular populations. One such survey has begun to be carried out by the Office of Population Censuses and Surveys (The General Household Survey: introductory report, HMSO, 1973) on behalf of government departments which is intended to be maintained on a continuing basis. This covers 15,000 households a year, selected at random from addresses on the electoral register. In the first round of enquiries, questions were asked about the employment, leisure activities, education, country of origin, smoking history, family size aspiration, and income of all adults in each of the selected households. The questions about health and the use of the health services were elementary, but the answers can be elaborated at a later date by further interview and the nature of the questions can be changed from year to year.
A sample of 15,000 households will be large enough for many purposes, but several years’ data will be needed to provide information about the less common events or to enable comparisons to be made between regions. A larger survey of some 250,000 households was needed to provide detailed information about the frequency of physical handicap, and the extent to which handicapped people were receiving the various health and welfare services provided for them. This survey, which was carried out by Harris, Cox, and Smith (Handicapped and impaired in Great Britain, hmso, 1971) on behalf of the Health Departments in England, Scotland, and Wales, found that some 8 per cent of people living in private households complained of some degree of physical disability, the proportion increasing from 4 per cent at ages 16 to 64 years to 28 per cent at 65 years and over. Of those who complained, the proportion who suffered a severe handicap increased from 10 per cent at ages 16 to 29 years to 24 per cent at 75 years and over. Half of those who were severely handicapped had regular attention from their general practitioners and two thirds were helped by at least one of the other health and welfare services. Arthritis was easily the most common cause of impairment, but the survey provided no information about how many of the disabled could have been relieved by for example, reconstruction of the hip joint. For this and other similar purposes more intensive enquiry is needed and regional and area authorities that are taking their job seriously will want to carry out surveys of their own making use of the existing network of health visitors and general practitioners.
Social Acceptability
Complementary to medical outcome and constituting with it the quality of the service is the patient’s reaction to the outcome and the way it is achieved. At present our knowledge of social acceptability is obtained in a variety of ways: through Parliament, lay representation on boards and committees, complaints and the machinery to investigate them, and the sensitivity of the health service staff to the feelings of their patients. None of these could be described as scientific. From April 1974, the number of lay representatives on management committees has been reduced and public opinion is to be expressed on Community Health Councils, parallel to but independent of the management structure. The responsibility of elected representatives has been modified by the removal of public health from the control of local government and the inclusion of a few Local Authority nominees on the Area Health Authorities. In my view these changes will not provide much improvement (if any) in our means of assessment. If we are trying to introduce scientific principles into management to achieve economic efficiency—as the new management structure is supposed to do—we should also try to use them to assess its effects. Otherwise we shall run the risk of creating a relatively cheap service that is good at preventing and curing disability, but which fails to care for it to the satisfaction of the public.
Survey of public opinion
The appropriate method is, I think, the medical equivalent of ” market research ” by which patients are asked their opinion of the service they have received and comparisons are made between the results obtained at different places and at different times. A beginning was made by the King’s Fund, when a questionnaire was distributed to 2,171 patients discharged from ten hospitals in five hospital regions (W. Raphael, Patients and their hospitals, King Edward’s Hospital Fund, 1969). Some typical results are shown below. Only 62 per cent (1,348) of the questionnaires were returned and it is possible that the fairly high level of patient satisfaction—with most aspects other than the wcs—is an artefact due partly to the poor response rate and partly to the fact that half the questionnaires had to be returned before the patients left hospital. Four years ago a similar questionnaire was distributed to nearly 5,000 patients discharged from the Radcliffe Infirmary, Oxford, with a view to comparing the service in different wards. On this occasion the questionnaires were mailed a few days after the patients had left hospital and 85 per cent were returned. The overall satisfaction rate was much the same as in the King’s Fund Study, but it was notable that only 75 per cent of the patients not admitted as emergencies said that they had had long enough notice of admission compared with 91 per cent in the earlier study.
RESPONSES TO QUESTIONNAIRE TO PATIENTS
per cent of patients
answering question yes adding critical remarks
| bed and bedding | ||
| comfortable? | 91 | 10 |
| enough privacy? | 94 | 3 |
| enough wcs? | 55 | 18 |
| supper satisfactory? | 91 | 0 |
| enough choice of | ||
| dishes? | 75 | 11 |
| visiting arrangements | ||
| suitable? | 90 | 12 |
| reception at hospital | ||
| satisfactory? | 95 | 3 |
| told enough about your | ||
| illness? | 82 | 7 |
Much could be learnt from the General Household Survey to which I have already referred. Often, however, we shall need to organise ad hoc studies like those carried out by A. Cartwright (Human relations and hospital care, Routledge and Kegan Paul, 1964), to discover people’s attitudes to hospital care and by Russell and Miller (in G. McLachlen and R. Shegog (editors), In the beginning, Oxford University Press, 1970), to assess the reaction of mothers—and their families—when women are discharged 48-72 hours after delivery. Such surveys will, I suspect, indicate a number of features that can be monitored objectively and independently. So far we have assumed that the length of time on waiting lists whether for admission to hospital, for an appointment at a hospital, or (of increasing importance) for an appointment with a general practitioner, provides a useful yardstick of the quality of the service that is being offered. The sort of questionnaire, to which I have referred will, I have no doubt, indicate many more. One that obviously needs to be monitored in Oxford is the length of notice that a patient receives when he is called for admission.
Equality of service
Another type of measure that should be used is the degree of variation in the quality of service throughout the country.
It was a declared aim of the Service, when it was introduced, that any part of it should be available to everyone regardless of “financial means, age. Sex, employment or vocation, area of residence, or insurance qualification” (National Health Service Bill: summary of the proposed service, HMSO, 1946) and this concept of equality contributed largely to its public welcome. That the act removed many of the inequalities that had existed under the previous system is evident; but it did not remove them all. Regional differences, for example, are still pronounced. Griffiths (“Inequalities and Management in the National Health Service”, The Hospital, 67, 1973) pointed out that the wealthiest Regional Board spent 69 per cent more per caput than the poorest in the early 1950s and still spent 64 per cent more in 1969/70 ; while Cooper and Culyer (” An economic assessment of some aspects of the National Health Service”, Health Services Financing, Report of British Medical Association Advisory Panel, 1970) found that areas which were poorly served by one criterion tended to be poorly served by others.
But is expenditure per capita the right criterion for judging the equality of the service? Should we not substitute equality of opportunity for equal treatment for patients at similar risk? It is, of course, easy enough to set up such an objective, but it is much more difficult to achieve. A beginning was made in 1971, when the Department of Health and Social Security introduced a formula designed to produce a more equitable distribution of funds between Regional Hospital Boards which incorporated elements based on population size, adjusted for the flow of patients between regions and weighted for age and sex, average daily occupied beds and outpatient attendances, and the turnover of patients. Much research will, however, be needed, before an effective formula can be found—including local surveys to determine need. If, as Hart suggests, an ” Inverse Care Law” still operates in that general practitioners in the areas with most sickness and deaths tend to have larger lists and less hospital support a great deal remains to be done before the initial aim of the Service is achieved (J. T. Hart, ” The inverse care law”, Lancet 1, 1971).
Economic Efficiency
Consider now the use of monitoring to improve economic efficiency. I am not concerned here with the standard process of ‘budgetary control to check that money is spent in amounts that have been approved, but with the collection of information about the ways in which prevention, care, and cure are delivered, and their costs and corresponding benefits; in other words with the application of cost benefit analysis to the procedures of the Health Service.
To the simple minded economist this is a perfectly straight-forward proposition.
All we have to do is to establish production functions for the various activities of the service, elicit the preference function of the community for the output of the system, and then maximise the difference between total social benefits and total social costs. True enough (or so economists tell me), but not very helpful.
In practice it is extremely difficult to implement for several reasons, two of which are of particular concern to the medical profession.
First the production functions, by which is meant the relationship between the input into the system in terms of doctors, nurses, drugs and so forth and the outcome in terms of the improvement in the health status of the patient, is difficult to quantify because of the need to apportion joint costs of common inputs between different outputs. (The economist would insert the qualification that the cost points were marginal, a technical consideration of practical importance which would further increase the difficulties). Secondly, the preference function of the community, by which is meant the relationship between the community’s relative preferences for alternative objectives, is a will o’ the wisp, because we do not know how to formulate specific health objectives in such a way that they represent genuine alternatives between which the community may choose.
The cost of inputs
Consider the first problem. This is the one which Cochrane described so pungently in his Rock Carling Lecture (Effectiveness and efficiency, Nuffield Provincial Hospital Trust, 1972). So long as the outcome was satisfactory, doctors have given little thought to the cost of the means by which it was achieved(except occasionally to the cost of drugs) and a great deal of work ought to be done to provide information about the relative costs of obtaining the same outcome by different means. Cochrane listed the three main causes of wasteful input as: the use of ineffective remedies, the incorrect place of treatment (in-patient when out-patient or home treatment would suffice), and incorrect duration of stay in hospital—to which we might add the incorrect duration of time off work whether in hospital or out.
The potential saving from shortening hospital stay is well illustrated by the data for Scottish hospitals reported by Heasman and Carstairs (” Inpatient management; variations in some aspects of practice in Scotland”. British Medical Journal 1, 1971). The median duration of stay for the surgical treatment of peptic ulcer under the care of surgeons who treated at least 20 patients during a year varied between surgeons from 6 to 26 days, while the median duration of stay for the medical treatment of myocardial infarction under the care of physicians varied between physicians from 10 to 36 days. Very little of this variation can be attributed to chance and it seems unlikely that the patients treated by different consultants varied so greatly in character. It does not necessarily follow that the shortest duration of stay was the best, from the point of view of medical outcome or of social acceptability—but at least the possibility of reducing the longest durations can be considered. The value of the Scottish system, in which information of this sort is sent confidentially to each consultant, is that it provides him with the opportunity of comparing his own practice with that of his colleagues. Without this information, the consultant is deprived of the option of making rational adjustments to his actions in the future. With it, he can modify his treatment or, if doubtful of the effect, can undertake a randomised controlled trial in collaboration with his colleagues. Such trials are now being carried out by Holland and his colleagues at Frimley to determine the optimum duration of stay following elective surgery for hernia or varicose veins (G. K. Matthew, Portfolio for Health, Oxford University Press, 1971).
Annual Throughput Of General Medical Patients Per Bed
Regional hospital annual throughput
Princess Margaret (Swindon) __ 37.2
Kettering General ______ 35.1
Northampton General _____ 35.2
Wycombe General _____ 29.2
Royal Berkshire _____ 29.2
Stoke Mandeville _____ 23.2
Horton General _______ 19.1
Amersham General______ ____ 18.6
Teaching hospital annual throughput
Radcliffe Infirmary (Oxford) 37.0
Cardiff Infirmary 36.6
RVI (Newcastle) 30.5
Royal Infirmary (Sheffield) 29.3
Addenbrooke’s (Cambridge) 29.0
Royal Infirmary (Bristol) 29.0
Churchill (Oxford) 21.2
Queen Elizabeth (Birmingham) 18.7
Comparisons on a larger scale between hospitals and between regions are documented regularly in the publications of the Department of Health and Social Security (Digest of Health Statistics for England and Wales, 1971, HMSO, 1973) and in the records of the individual regional boards. One of the most convenient indices of performance is the annual throughput per bed: that is, the number of patients discharged per annum divided toy the average number of available beds. I am grateful to my colleague Dr Jeremy Cobb for illustrative figures for the throughput for general medicine in a number of hospitals, shown in the table above. I cite these not to show the differences, but to emphasise the danger of drawing superficial conclusions. It is only too easy to conclude from such figures that Princess Margaret Hospital, Swindon, and the Radcliffe Infirmary are providing the National Health Service with a more efficient service (if the costs were equal) than other hospitals of the same type, just as it is easy to conclude that Wales with 3.7 acute specialty beds per 1000 population could reduce its number to the 2.3 per 1000 that is provided in the Oxford Region. Obviously in comparing hospitals we must consider the type of patient that is being admitted and the local need; but we must do much more than that before we can attempt to fix a norm. We must at least try to find out whether the high rates of throughput result in greater re-admission rates, what the strains are on the staff, and whether the general practitioners, patients and relatives are pleased with the quick discharge or not. One undesirable effect of the rapid throughput at the Radcliffe Infirmary, to which I have already referred, is that patients receive inadequate notice of their date of admission. In economics, as in medicine, we can reach sensible conclusions only when we compare like with like and many aspects have to be taken into account before it can be accepted that the cheaper procedure is indeed the most efficient.
The sort of comparisons I have described are all in effect attempts to examine different means of achieving the same outcome, with the corollary that we should choose the cheapest, subject to it being socially acceptable. It is something that health workers will need to attend to more in the future, so that money can be saved and used to the best advantage within the service.
Evaluation of output
The second problem is much more difficult, but without a solution there is no possibility of carrying out a proper cost-benefit analysis of the service as a whole.
What needs to be done is to find a means whereby the benefits of the service can be measured in the same units as are used to estimate its costs. In other words we need to express in the same units the value of preventing mental deficiency in a child, of saving the life of a 70 year old man, and of relieving the pain associated with a chronic duodenal ulcer, or in Card’s words we need to estimate the ” utility” of particular states of health and to establish their monetary equivalents (Computer assisted diagnosis and pattern recognition : the computing approach to clinical diagnosis, Proceedings of the Royal Society, London B, 184, 1973). Only by this means can we hope to choose rationally between different outcomes for the same level of expenditure.
The simple economic benefit of getting a man back to work is easily calculated, but is clearly unacceptable as the sole measure of utility for many reasons, including the negative value which it would set on the life of all those who have retired. To it, we have to add a humanitarian value and it is this which is so fiendishly difficult, if not impossible, to express in comparable units. The difficulty has been well illustrated by Williams and his colleagues at the University of York (Culyer, Lavers and William, ” Social indicators: health “, Social Trends, 2, HMSO, 1971). First, we should have to establish an index of ill health that would allow both for its intensity and duration. The difficulty, of course, lies in measuring intensity which has the two dimensions of painfulness and restriction of activity, including within the latter psychological as well as physical restrictions. If it could be established we should have a scale along the following lines.
INDEX OF ILL HEALTH
- 0 normal
- 1 normal activity with some discomfort
- 2-8 intermediate categories reflecting various degrees of pain and restriction
- 9 unconscious
These measures of society’s judgment, it will be noted, are not just rankings of preference; they are quantitative measures of relative importance of avoiding one state rather than another, because the cost-benefit analyst will use them in his equations as weights. That is to say, state 2 must be just twice as bad as state 1, and state 10 ten times as bad.
HYPOTHETICAL EXAMPLE OF MEASURE OF INTENSITY AND DURATION OF DISABILITY WITH AND WITHOUT MEDICAL INTERVENTION
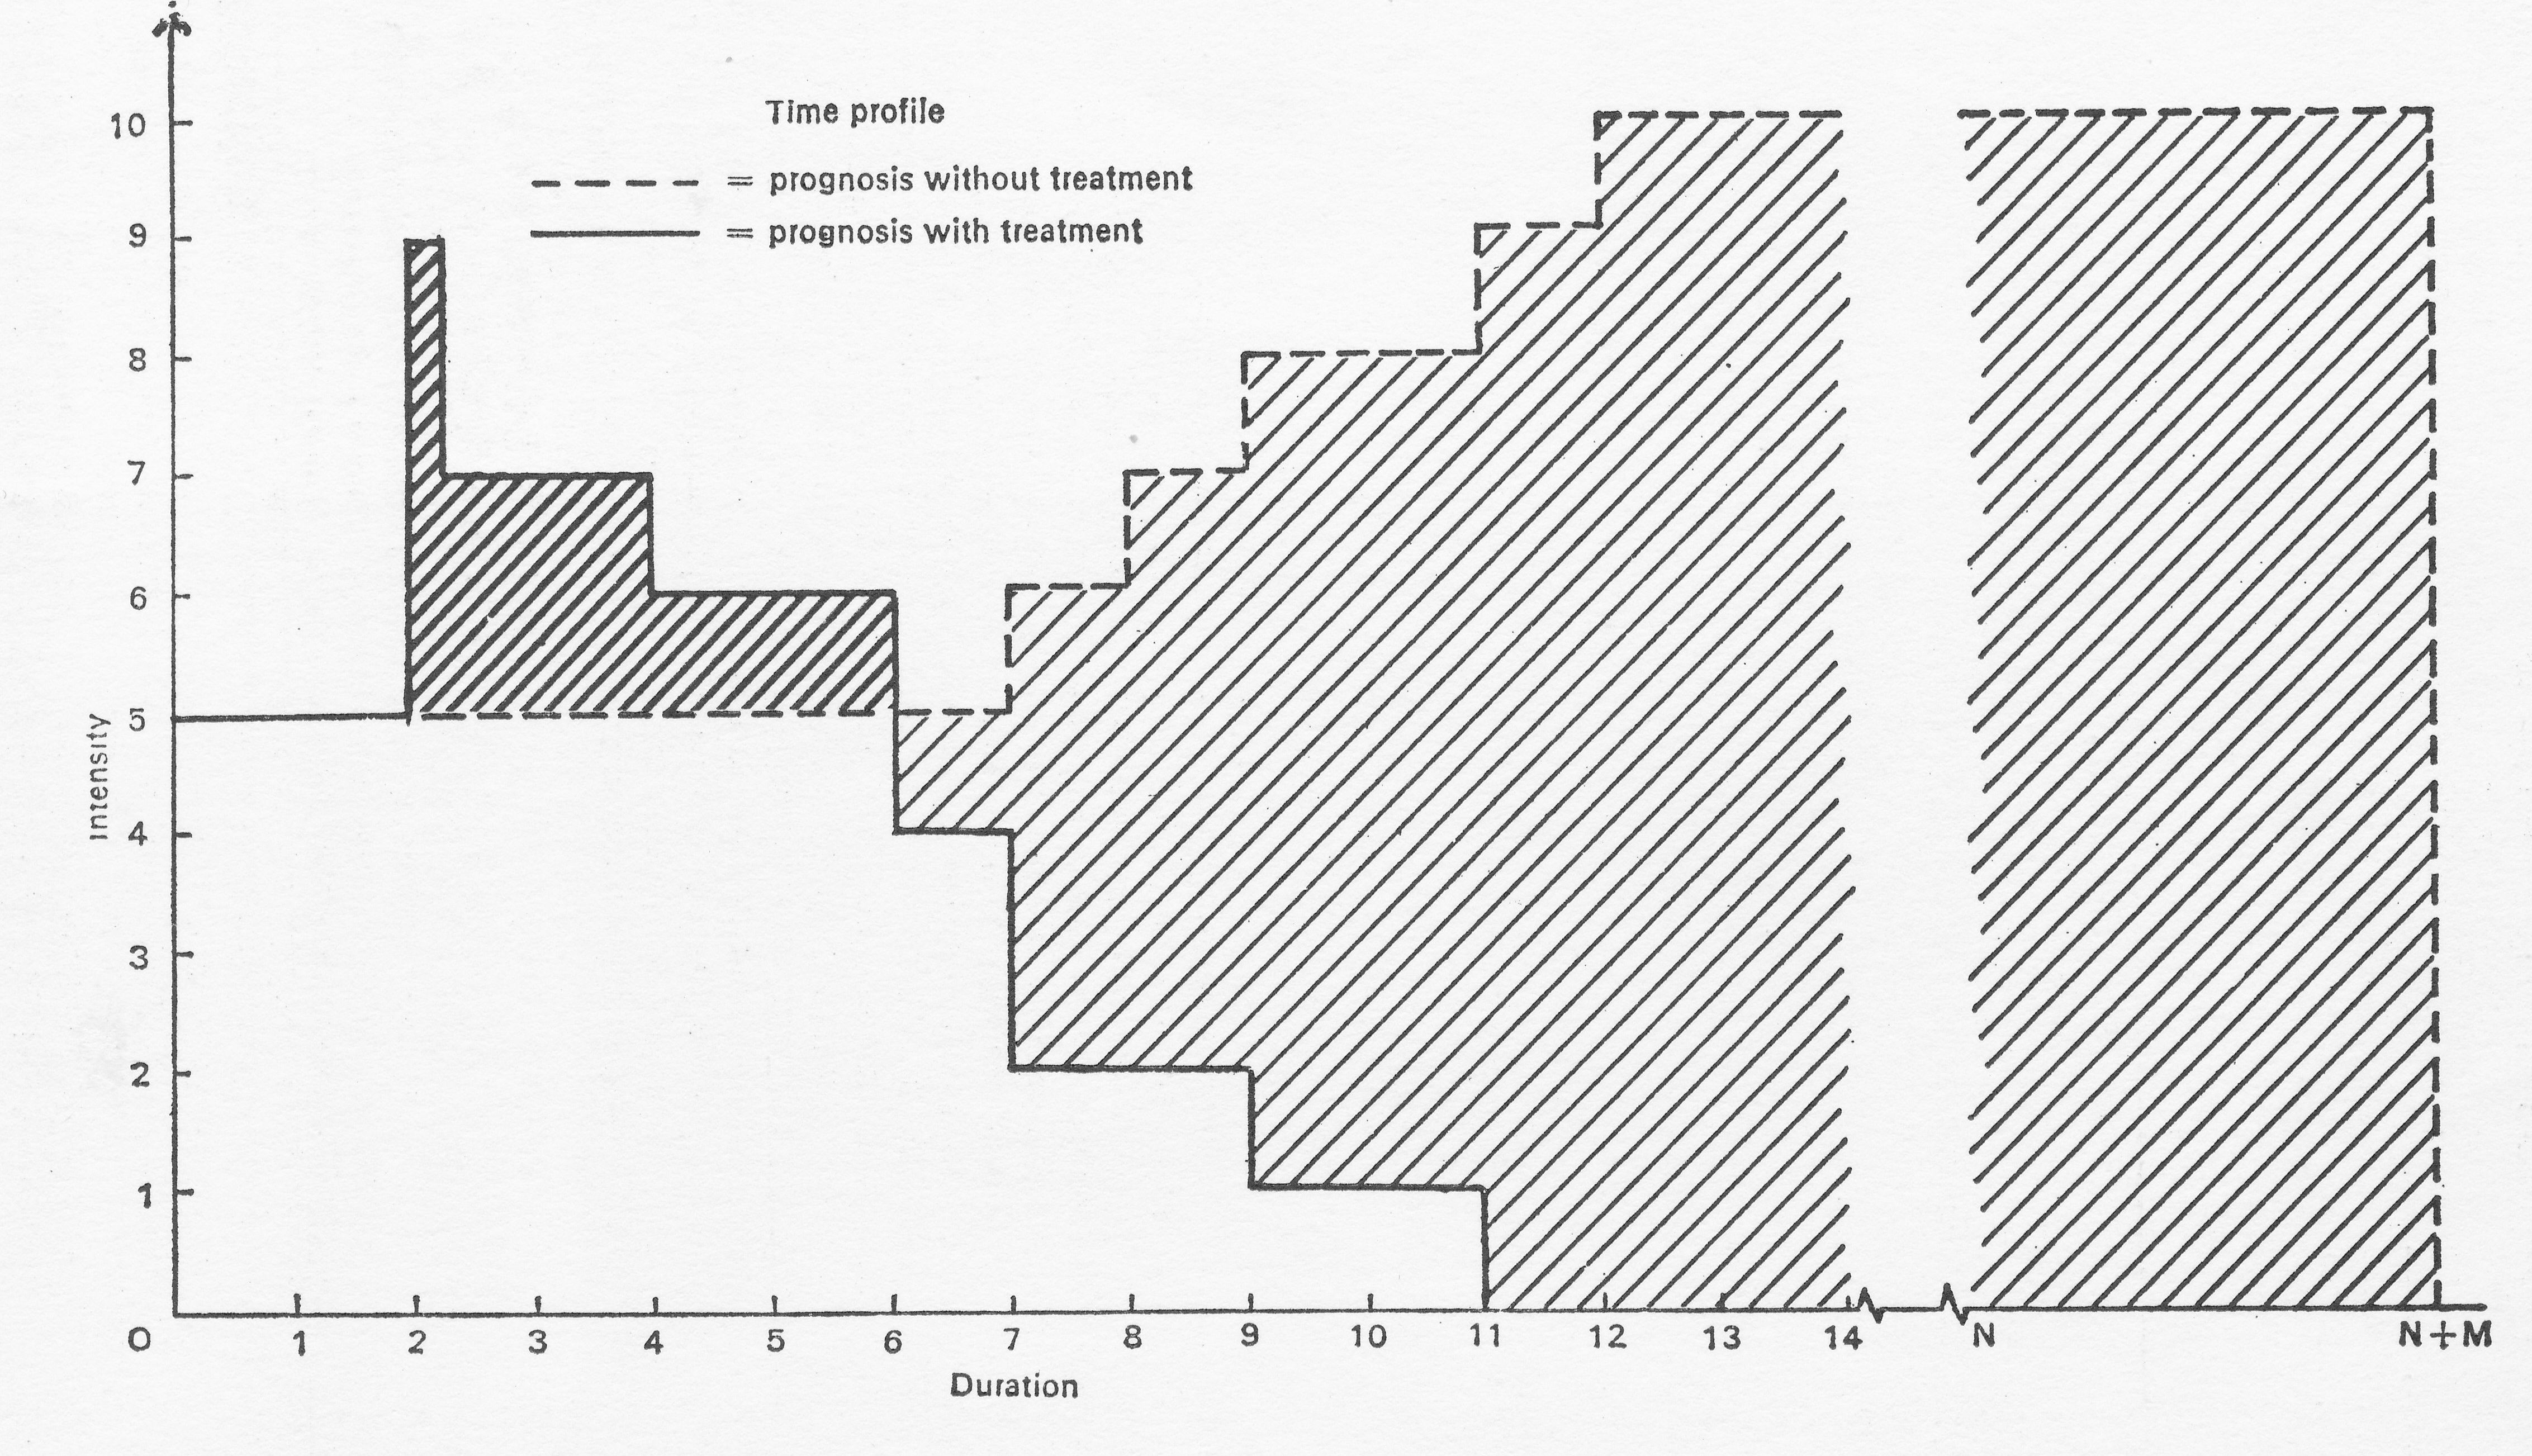
Having obtained our index, we then have to estimate the time it would have lasted in the absence of treatment. The graph is taken from the paper by Williams and his colleagues and shows how the final value of the treatment is secured by subtracting the index points for the extra discomfort and disability produced by the treatment from those predicted in its absence. In the illustrated example the condition is diagnosed at point 0, and the first two weeks are spent in investigation and arranging for treatment. In the absence of treatment there is steady deterioration from week 7 to death at week 12; with treatment there is increased disability and pain for 4 weeks (presumably following an operation) and normal healthy life from week 11 to the completion of the expected span for a person of that age and sex after nm years. Finally, having obtained our index, we shall have to weight it to take account of the effect of the patient’s health on his relatives and the community at large.
Frankly, I do not believe that such a proceeding is possible—certainly not in my life time—though I respect the reasons which lead serious investigators to undertake research into the means by which it could be achieved. The trouble is that different outcomes are incommensurate. Being dead is not, and never will be, just ten times—or a hundred times— as bad as having some discomfort in the course of normal activity. Administrators, however, still have to allocate limited resources and to decide the order of their priorities. Decisions have to be made subjectively and in practice are the result of a judicious balance of competing pressures. It is a field in which gardening is real, and botany is bogus; but we should at least try to help the gardener by clarifying costs and describing the output precisely, even though we cannot summarise it in a single quantitative measure.
CONCLUSION
Monitoring, medical intelligence, information science, call it what you will, the subject is enormous and, with the exception of our national vital statistics, the uses of which were seen clearly by Farr more than a century ago, it has hardly begun to be developed. No doctor would, I think, have been more interested in it than Somerville Hastings, for he was never content to put up with the second best when factual information was available to show that something better could be achieved. He would, I think, have wanted to lay particular stress on one aspect of the subject: the measurement of progress towards the goal of providing equal opportunity for equal treatment, “regardless of financial means, age, sex, employment or vocation, area of residence, or insurance qualifications “. How such measurement can be made will be, I hope, one of the primary tasks of the specialists in community medicine of the new Regional Health Authorities, aided by the corresponding University Departments. Equality, however, is not everything. Central though it is to the concept of the service, it must not be allowed to become the sole criterion. Progress depends on innovation and it is also important to encourage local initiative to set new standards and to prove their worth.