Health inequalities today are unfair or unjust differences in health determinants or outcomes within or between defined populations.
Determinants are the causes and influences; outcomes are diseases and states of health
Health services are thought to influence about 30-40% of health status
Unfair or unjust differences in health determinants:
The world’s richest 85 people have a combined net worth of US$110 trillion – equal to the total assets of the poorest 50 percent of the world’s population: about 3.5 billion people
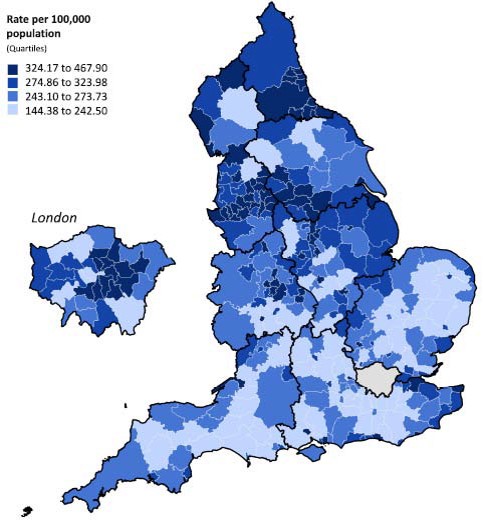
Unfair or unjust differences in health outcomes in England
– all cause mortality (in under 75s), 2006-08
Public policy determinants of health inequalities today:
- Economy
- Social security
- Agriculture
- Food
- Environment
- Transport
- Housing
- Employment
- Health care
- Social services
- Education
- Crime
- Discrimination
- Arts
- Leisure
- Recreation
- Defence
Inequalities in what?
Health:
- Mortality
- Morbidity
- Well-being
Health care
- Access – physical / financial / opportunity cost
- Quality – clinical / process
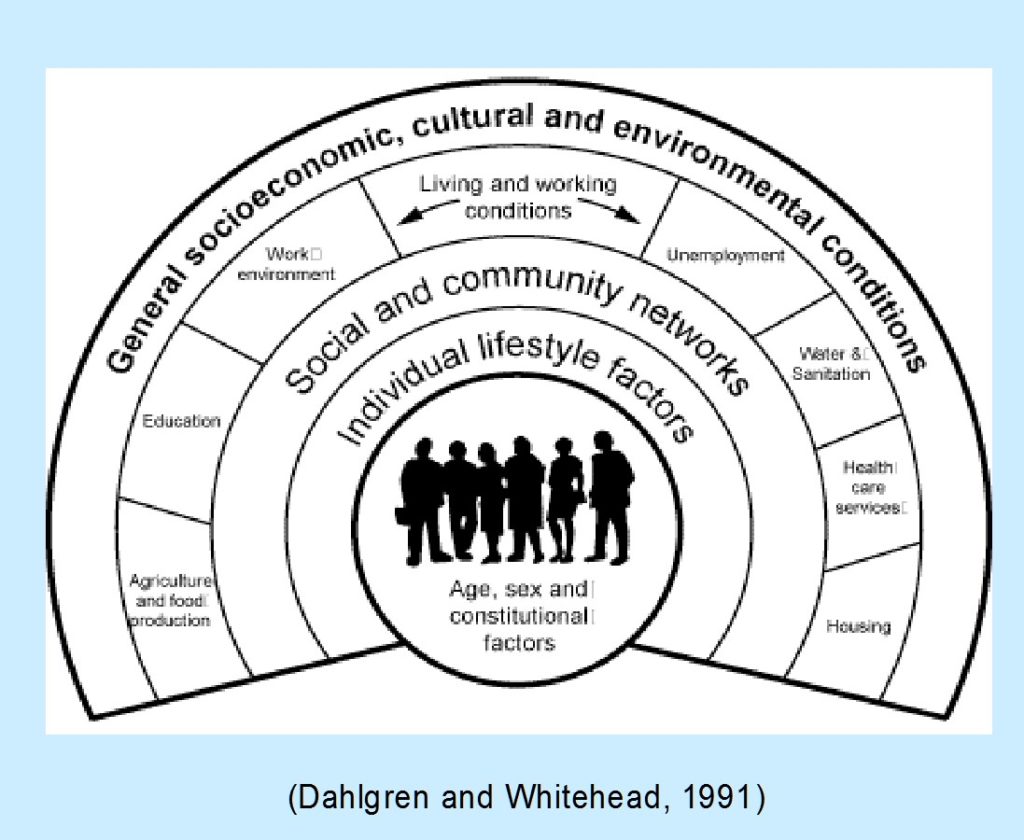
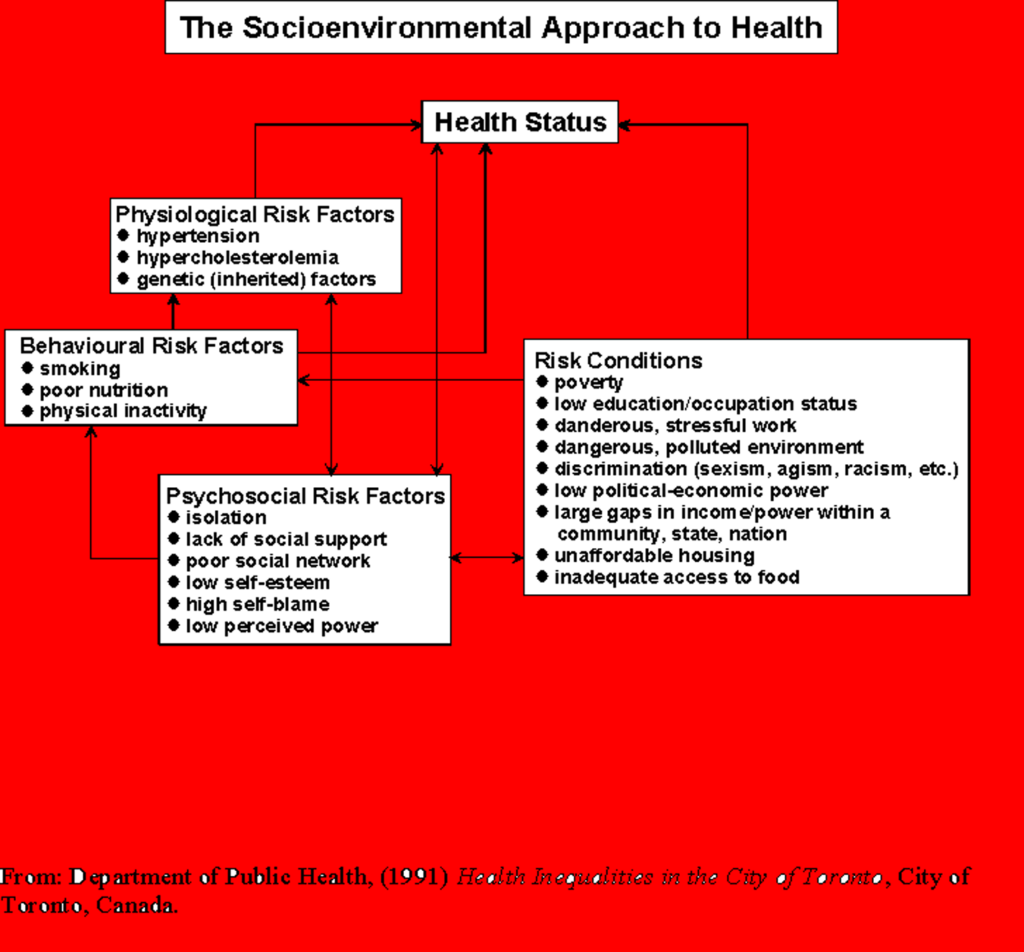
‘Wider’ determinants of health
- Structural
- Cultural / behavioural
- Environmental
Health determinants act at multiple levels
Health equity (fairness in health) could be described as
…from each according to his abilities, to each according to his needs…
Karl Marx, Critique of the Gotha Programme (1875)
Distributional justice: Inequity in policy (eg positive action / discrimination) is required to achieve equality of outcome
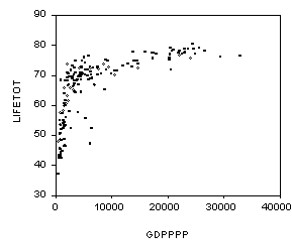
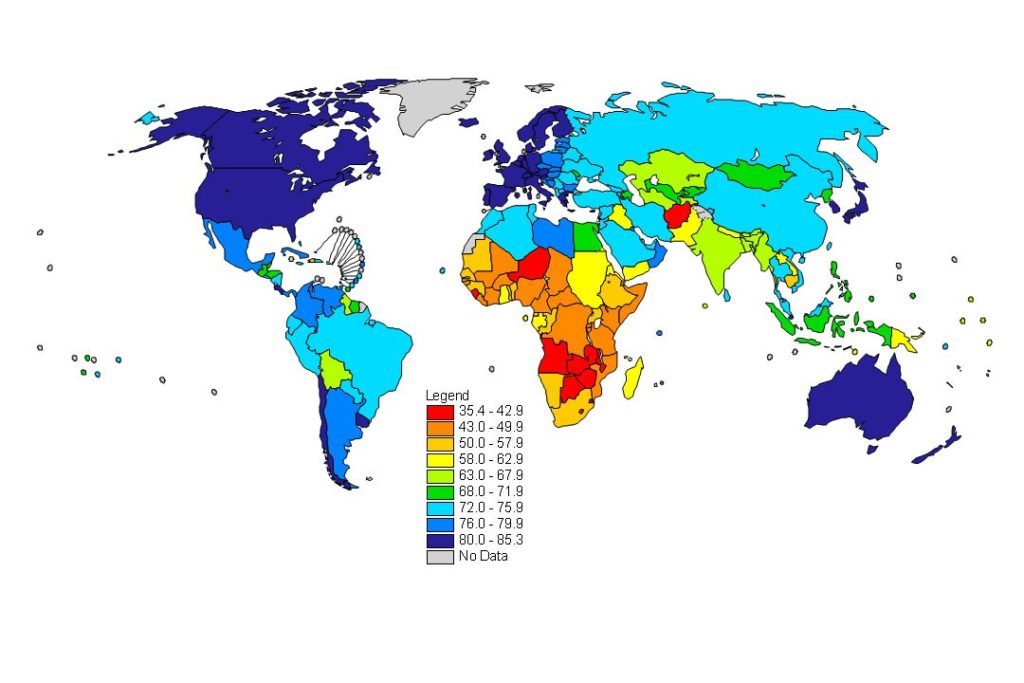
Total life expectancy and GDP for 209 countries in 1997:
Source: World Bank’s World Development Indicators 2000. Life expectancy is for both males and females, in years, from birth. GDP figures are in international dollars, which use purchasing power parity in order to provide a standard measure of real price levels between countries.
Presented at our policy seminar June 2016